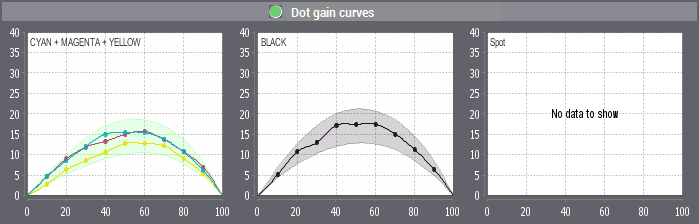
Based on the measured data, the dot gain is determined in steps of 10% and at 25% and 75% for the defined process colors, and curves display the result.
•CMYK process: The dot gain curves are shown separately for the three chromatic colors cyan, magenta and yellow and for black as their tolerances are different.
•Multicolor process and spot color process: As of version 11.0. a third diagram displays, showing only spot colors or the multicolor process colors. You can select a multicolor, spot color or PSO standard (for the CMYK colors of your color data) as your process standard for the check.
You can find more details in the 'Dot gain' View.