The report shows the progress of measured values for Delta E, density and dot gain. The results are displayed in the same way as they are visible to the operator of the colorimeter. For this reason, the report can be used as the basis for discussion between the production manager (Cockpit operator) and the press operator.
Prerequisites
See Requirements.
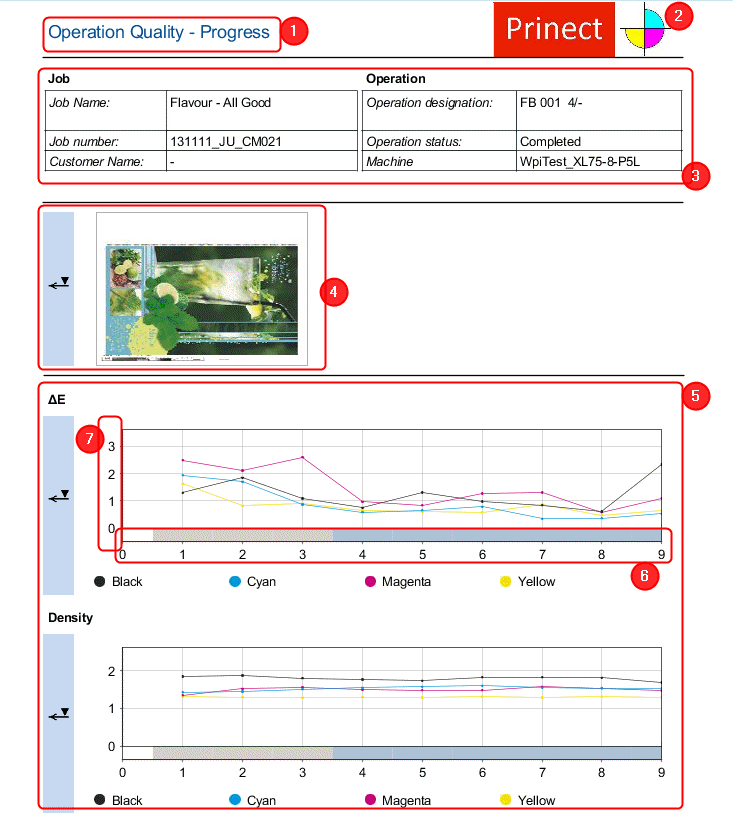
Report title (1)
The logo you selected (2). See Logo.
Header data (3):
•Information regarding the job
•Information regarding the operation
Thumbnails for front and back (4)
Charts for Delta E and density each for front and back (5):
•X axis (6):
·Representation of printing phases Makeready (gray) and good production (blue)
"Makeready" displays only if measurements for waste sheets were enabled in the presettings (see Show measurements for waste sheets in the report).
·Graduation of axis for "Measurement", "Time" or "Prints".
The reference values depend on the presettings (see Changing the Reference Value in the "Progress" Report).
•Y-axis (7):
·Graduation of axis for: Delta E / density color deviation in %
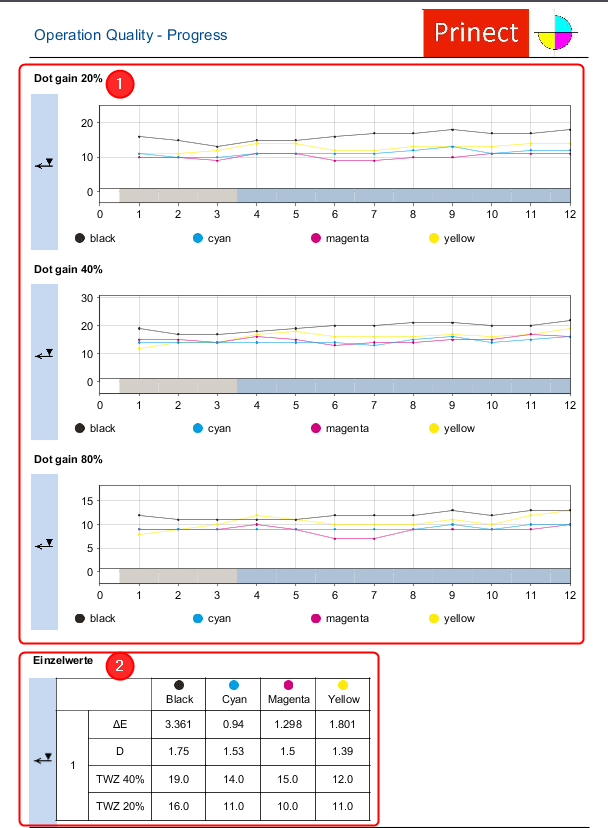
•Dot gain (1):
•Representation of the dot gain for all measured dot gains.
•Single values (2):
Display of the measured values for dot gain, Delta E and density for each measurement.
The single measurements display only if this is enabled in the presettings (see Show single values of measurements in the "Progress" report).
Show measurements for waste sheets in the report
Only measurements for good sheets or all measurements (good sheets and waste sheets) can be analyzed in the "Progress" and "Zone analysis" quality reports. This is a global setting.
Proceed as follows to change this setting:
1.Go to "Analyze Point > Jobs".
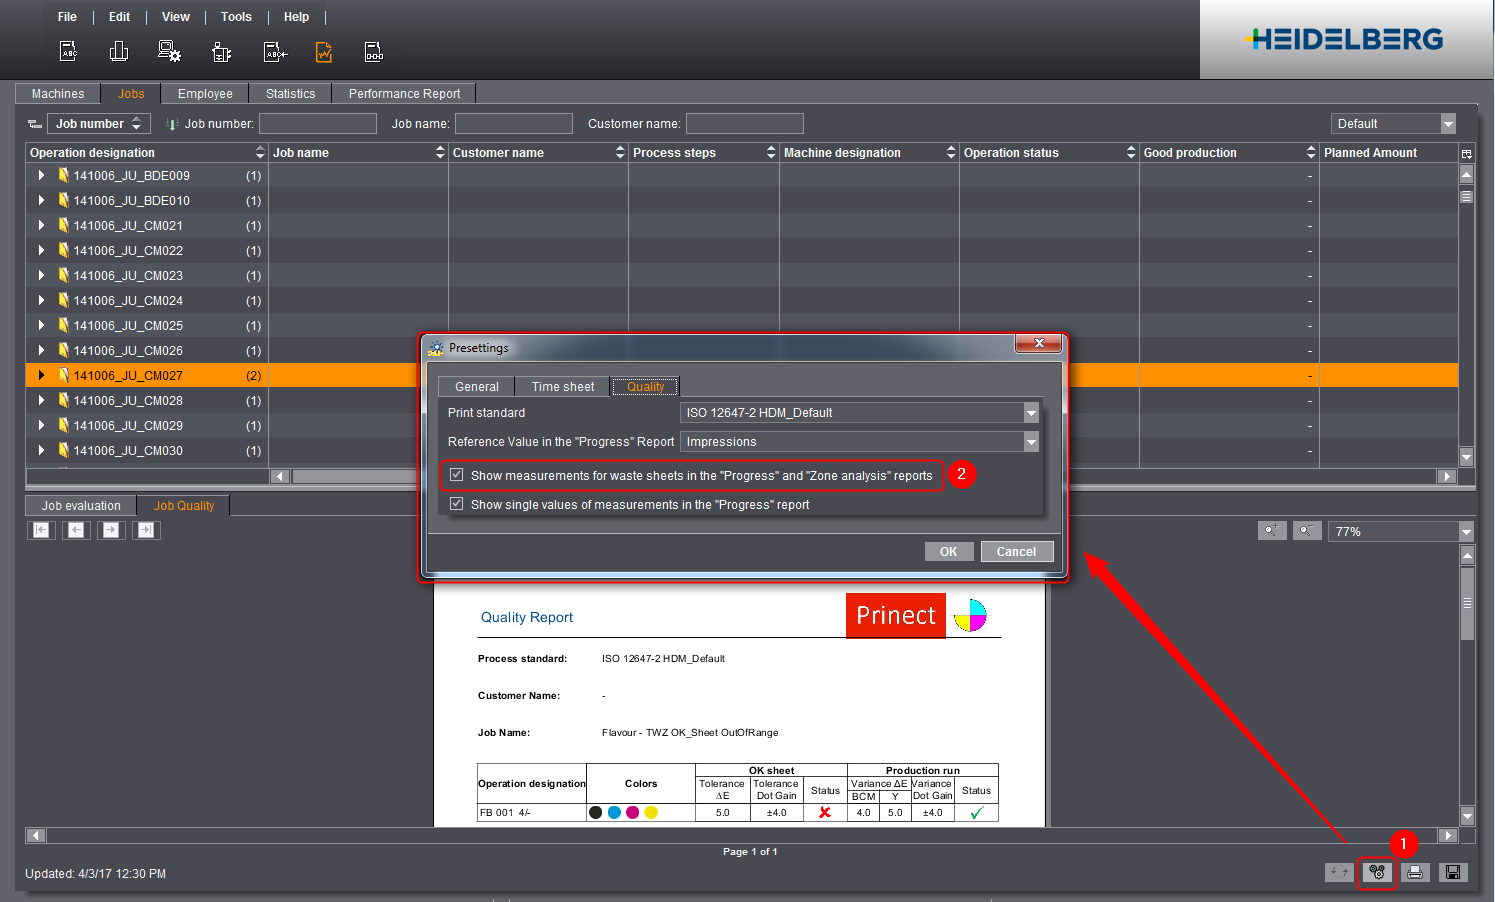
2.Click the "Presettings" icon (1).
The "Presettings" dialog displays.
3.Enable/disable the option "Show measurements for waste sheets in the "Progress" and "Zone analysis" reports".
·Option is enabled
Measurements of good sheets and waste sheets are displayed in the reports.
·Option is disabled
Only measurements of good sheets sheets are displayed in the reports.
4.Click "OK".
This setting is immediately applied to all reports.
Show single values of measurements in the "Progress" report
Single values of measurements for Delta E, density, and dot gain can be listed in the "Progress" quality report in tabular form. This is a global setting.
Proceed as follows to change this setting:
1.Go to "Analyze Point > Jobs".
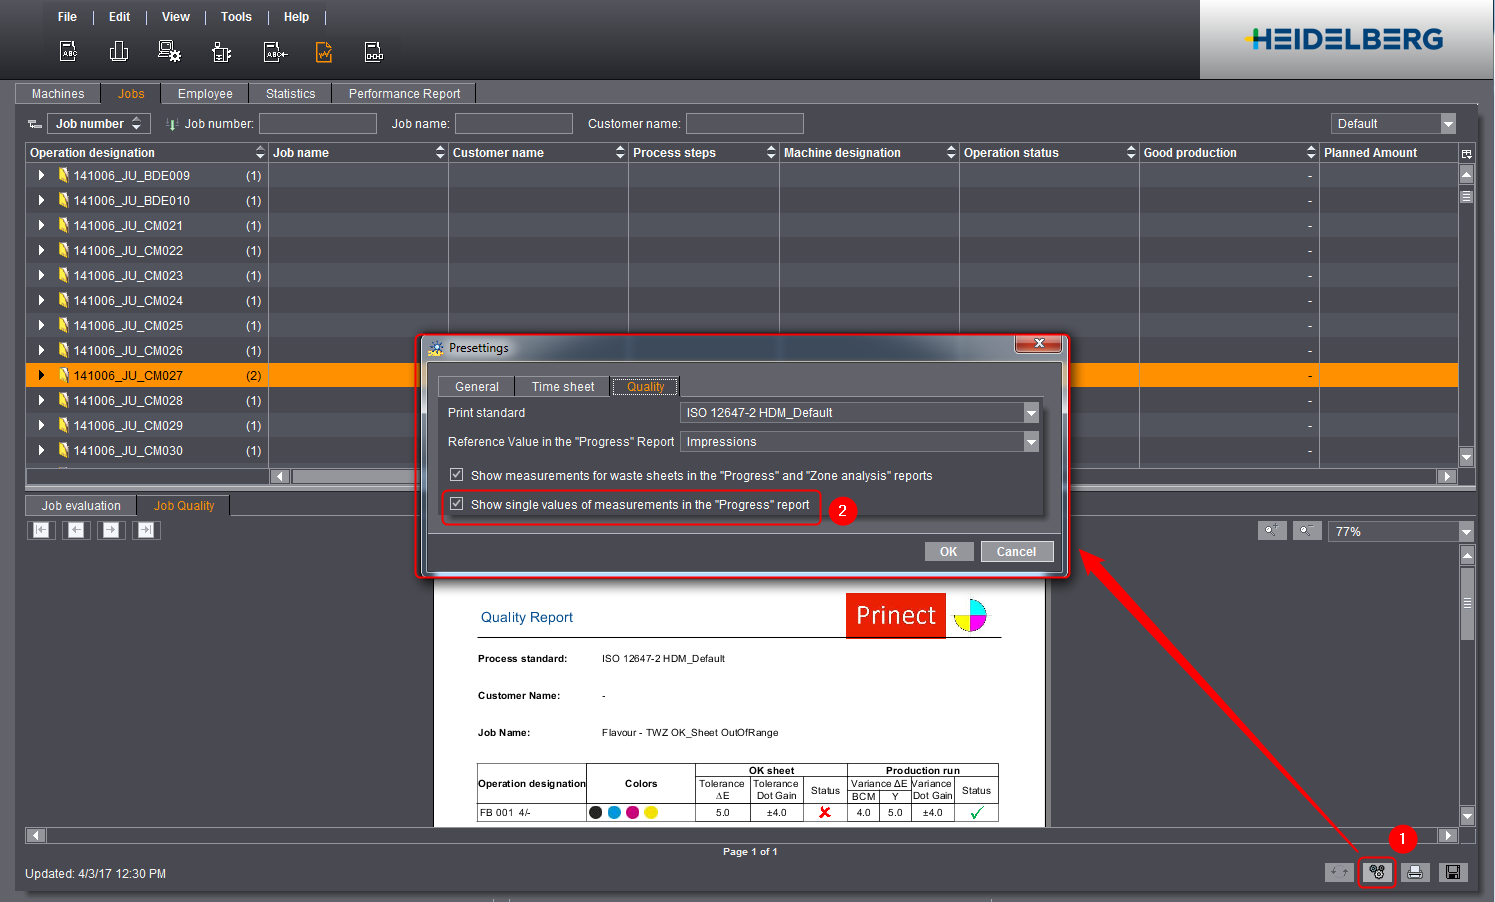
2.Click the "Presettings" icon (1).
The "Presettings" dialog displays.
3.Enable/disable the option "Show single values of measurements in the "Progress" report" (2).
4.Click "OK".
This setting is immediately applied to all reports.
Changing the Reference Value in the "Progress" Report
In the "Progress" quality report, each measured dot gain value is shown with reference to a set value. The time of each measurement can be displayed, for example. This is a global setting. You can choose from three reference values:
•Measurement
The Measurement Number for each measurement is displayed.
•Time
The time of a measurement is displayed.
•Impressions
The measured sheet is displayed.
Proceed as follows to change the reference value:
1.Go to "Analyze Point > Jobs".
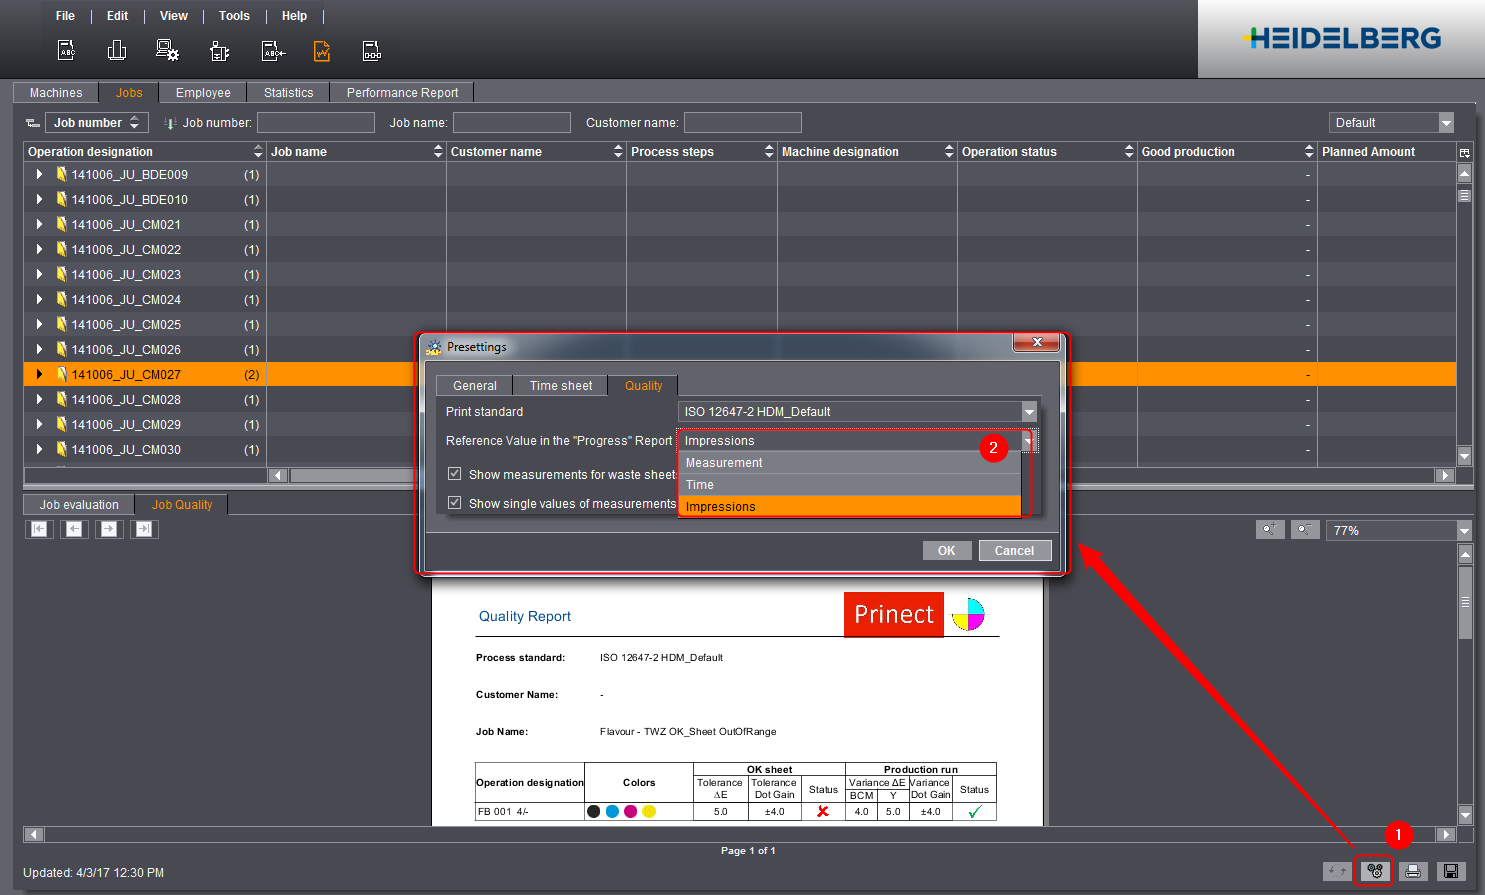
2.Click the "Presettings" icon (1).
The "Presettings" dialog displays.
3.Select the reference value you want in the "Reference Value in the "Progress" Report" list (2).
4.Click "OK".
This setting is immediately applied to all reports.