Operation Quality "Zone Evaluation"
The reports show quality evaluations of each ink zone of the selected operation. This lets you easily identify critical ink zones. The zone analysis covers the measured values Delta E, density and dot gain. There is a separate quality report for each of the measured values. Select the desired report with the query criteria in the navigation pane to the left.
Report "Zone Analysis"
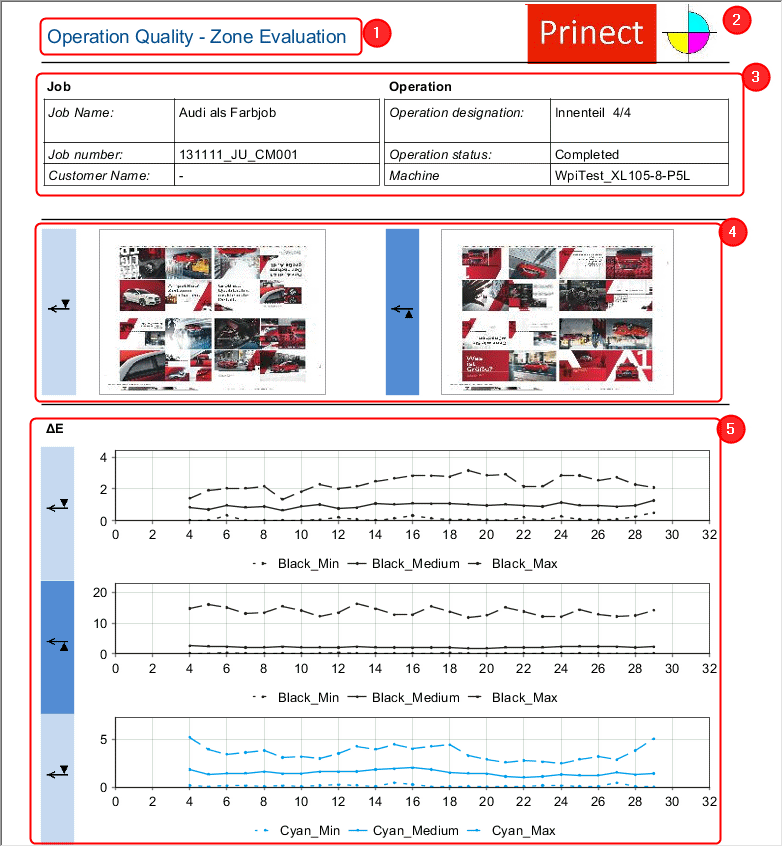
(1) Report title
(2) The logo you selected. See Logo.
(3) Header data:
•Information regarding the job
•Information regarding the operation
(4) Thumbnails for front and back
(5) Charts for zone evaluation:
Three measured values are shown for each ink zone: minimum dot gain, maximum dot gain, and medium dot gain. All measurements available for the operation (OK sheet and waste sheet measurements) are comprised.
•"Zone analysis ΔE" charts:

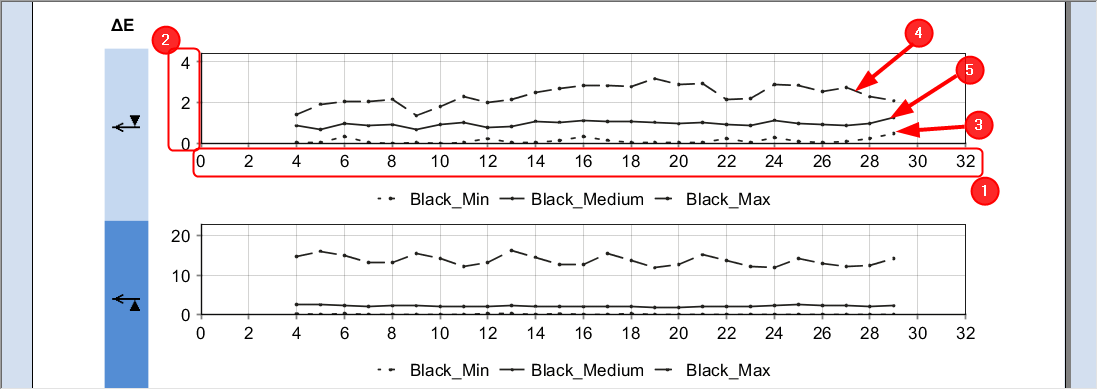
·(1) X axis:
Ink zones of the press
·(2) Y axis:
Delta E
·(3) Min Delta E:
Graph of the smallest measured values for Delta E for each ink zone
·(4) Max Delta E:
Graph of the greatest measured values for Delta E for each ink zone
·(5) Medium Delta E:
Graph of the average measured values for Delta E for each ink zone

Note: The values for Min and Max can be taken from different measurements. In other words, the smallest and the greatest value of all measurements are shown for each ink zone.
•"Zone analysis density" charts:

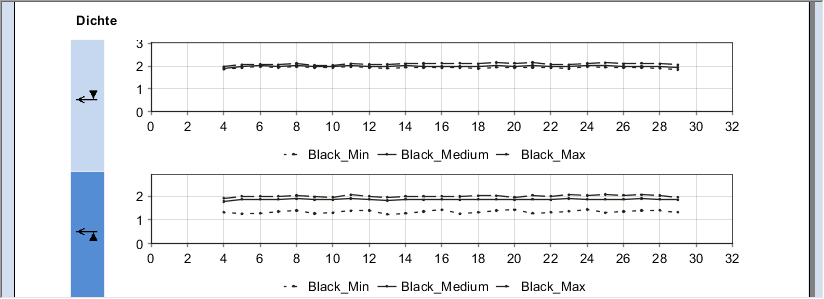
The structure of the "Zone analysis density" and "Zone analysis ΔE" charts is identical. In this case, the Delta E value is replaced with the density value.
•"Zone analysis dot gain" charts:
Zone analysis for each area coverage that has measured data (e.g. 20%, 40% and 80%).

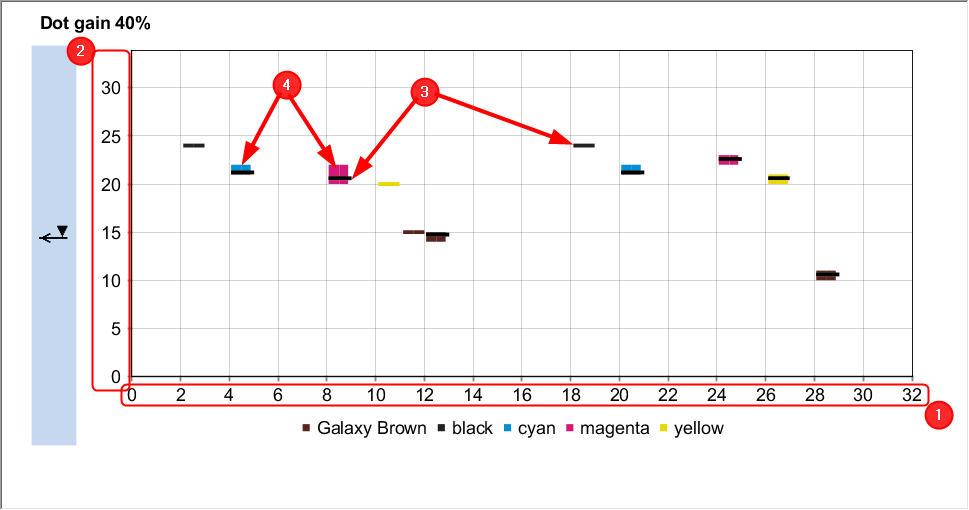
·(1) X axis:
Ink zones of the press
·(2) Y axis
Dot gain in percent
·(3) Average dot gain value:
A black line indicates the average measured dot gain of each ink zone.
·(4) Dot gain value deviations:
Dot gain deviations from the average value within one ink zone are represented by a column above and below the average value. In the example (figure above), Magenta in ink zone 9 deviates upwards by approx. 1.5 percent.

Note: There are only measured values for ink zones for which the control strip has dot gain measurement fields. This depends on the selected dot gain (e.g. 40%).
Measuring conditions:
The measuring conditions are indicated for each zone analysis.
In the "Employee" tab you can view the time sheets, including recorded times and quantities, of your employees. You can select from shifts lying up to 12 months in the past.
Customers using a Management Information System (MIS), which is not able to receive any status messages from production (JMF or proprietary format) very often use PDC terminals of the MIS or work with "paper time sheets" which have to be filled out in order to calculate job costing or to use the PDC data as an employee-related track record. This also applies to machines, which have already been automated (such as printing presses with Prinect CP2000 Center).
In these cases, the time sheet function is a simple and reliable way of recording time. After the end of the shift, the times from the time sheet can be entered manually in a SFDC terminal or other time-tracking system
The objective of the time sheet is to obtain a reliable data basis for job costing and performance analysis. Thus, the quality of data can be checked prior to introducing job costing.
The operations (PDC messages) must be mapped to the actions in the device configuration for actions to be recorded properly and displayed in the time sheet.
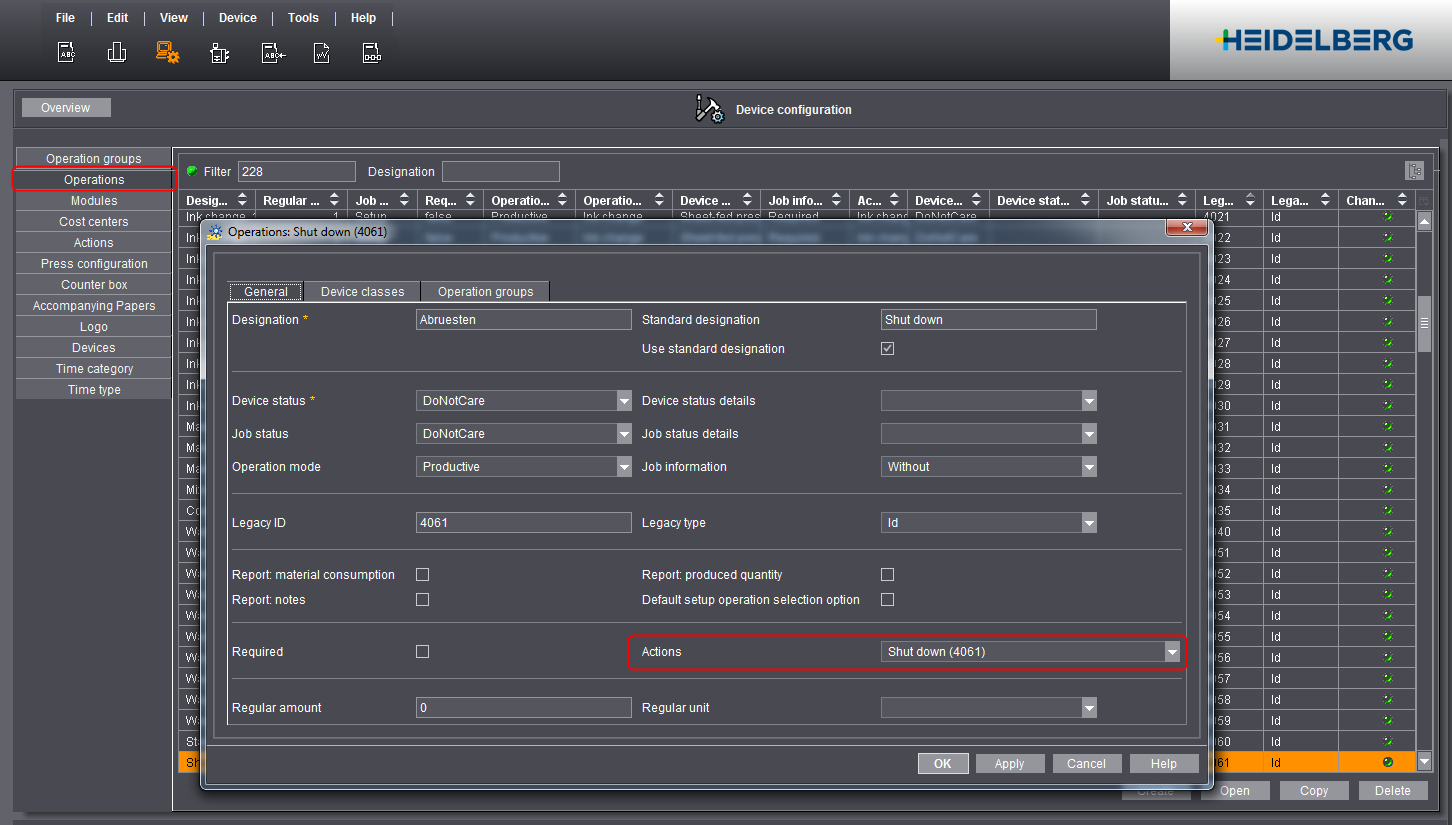
This means: You must create and assign an action for each of the operations (PDC messages) that are reported automatically or manually by the machine. The action is recorded in the time sheet when the operation message is sent. It is feasible to name operation and the respective action alike to find out which operation triggers which action in the time sheet.
Mapping of operation and action occurs when you set up operations in the "Actions" section (see the above screenshot). For details, see Creating a New Operation Group (Cost Group)
Creating Time Sheets of an Employee
Proceed as follows to create a time sheet:
1.Go to "Analyze Point > Employees".
2.Set up the "Month","Employee" and "Shift End" parameters.

•Month
This is where you select the month in which the time sheet was printed. Up to 12 months are available. The last 30 shifts display if you select "Current".
•Employee
This is where you select the employee whose time sheet will be displayed. All employees who have messages in the selected period are displayed.
This is where you select the shift for which the time sheet will be generated. As many as 100 shifts in the selected month are available.
What is a shift?
A shift is the period in which an employee was not logged out of the system longer than four hours. If an employee was logged out for a longer period, the last logout period is recorded as the shift end.
The time sheet is generated automatically and displayed at the bottom as soon as you have selected all the parameters.