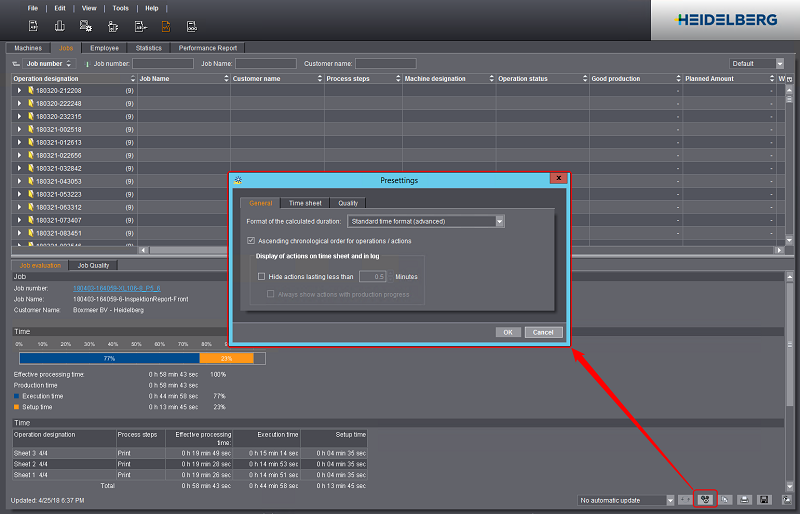
Depending on the mode of operation, you can choose different presettings for Analyze Point. These are divided into the following sections:
•"General" tab
e.g. change from standard time format to industry time format.
•"Time sheet" tab
e.g. enable the marking of unspecified times.
•"Quality" tab
e.g. change global print standard.
To set up presetting parameters, go to "Analyze Point" and click the "gear wheel" button:
Format of the calculated duration
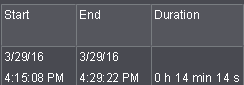
All times in Analyze Point are given either in industry time, standard time or advanced standard time.
Industry time:
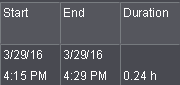
Standard time:
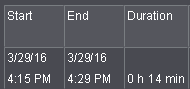
Standard time (advanced):
Ascending chronological order for operations / actions
You can sort all the logs in Analyze Point (time sheet, machine log, etc.) by time either in ascending or descending order.
Option enabled: the oldest entry appears at the top.
Display of actions on time sheet and in log
•"Hide actions lasting less than n Minutes":
With this option enabled, the operations that take less than the defined period of time are hidden in the "Time Sheet", "Machine Log" and "Operation Protocol". This makes the protocol in question easier to read.
•"Always show actions with production progress":
With this option enabled, operations with production progress that take less than the defined period of time are also shown.
Show Details
With this option enabled, the time sheet contains bar graphs showing times and amounts in addition to the log. See Time and Quantity (2).
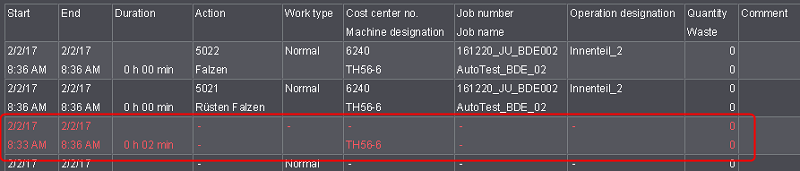
Mark unspecified times greater or equal n minutes
An operator may log in but forget to record operations (PDC messages). This happens especially on devices connected via a Data Terminal. In such a case, Analyze Point does not know what was done at a certain time and cannot assign an action.
However, it is helpful that these times display as blank lines in the time sheet. The operator can then enter on the printed time sheet which work was done in these periods.
You can set that times that are not recorded, either automatically by the machine or manually by the operator, are highlighted in red in the time sheet.
You can view the missing periods in the time sheet if "Mark unspecified times greater or equal n minutes" is enabled. By entering minutes, you define as of when a missing period will be recorded. A missing period as of 59 minutes is the maximum time you can view.
Print standard
This is where you define the global print standard for evaluating the color data in Analyze Point. This print standard is applied as soon as the quality data for an operation is received. Subsequent changes to the print standard only impact new jobs. The "Summary" Quality report is an exception. This is where you can also change the print standard for every operation at a later date. See Changing the Print Standard for Each Individual Operation. The global default print standard is "ISO 12647-2 HDM_Default".
Reference value in the "Progress" report
In the "Progress" quality report, each measured dot gain value is shown with reference to a set value. The time of each measurement can be displayed, for example. You can choose from three reference values:
•Measurement
The Measurement Number for each measurement is displayed.
•Time
The time of a measurement is displayed.
•Impressions
The measured sheet is displayed.
"Show measurements for waste sheets in the "Progress" and "Zone analysis" reports"
Only measurements for good sheets or all measurements (good sheets and waste sheets) can be analyzed in the "Progress" and "Zone analysis" quality reports. When this option is enabled, waste sheets are included.
Show single values of measurements in the "Progress" report
When this option is enabled, the "Progress" report displays the single values of measurements for Delta E, density and dot gain.
"Maximum dot gain at n percent" for "Quality" machine report
In the "Machine Quality" report, the dot gain representation on the Y-axis is limited to the maximum set here. This facilitates the overview because dot gain values are usually in the range between 0% and 15%. The default is 30% and can be changed to 40% or 50%. This results in a reasonable detail view even in case of a single measurement with a higher value.