The report shows the progress of measured values for Delta E, density and dot gain. The results are displayed in the same way as they are visible to the operator of the colorimeter. For this reason, the report can be used as the basis for discussion between the production manager (Cockpit operator) and the press operator.
Prerequisites
See Requirements.
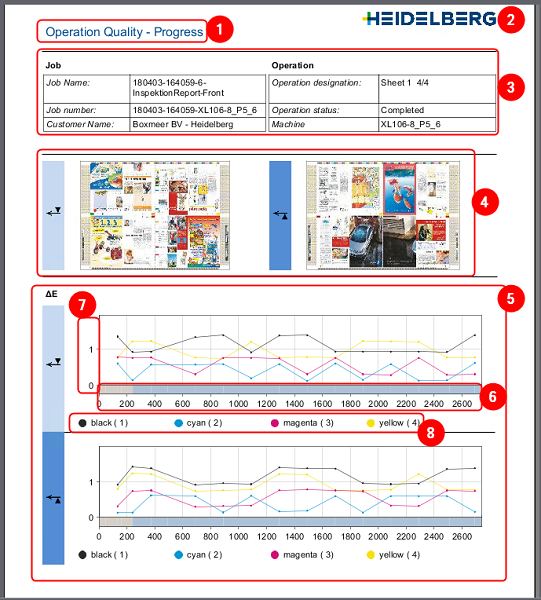
(1) Report title
(2) The logo you selected. See Logo
(3) Header data:
•Information regarding the job
•Information regarding the operation
(4) Thumbnails for front and back
(5) Charts for Delta E and density each for front and back:
•(6) X axis:
·Representation of printing phases Makeready (gray) and good production (blue)
"Makeready" displays only if measurements for waste sheets were enabled in the presettings (see "Show measurements for waste sheets in the "Progress" and "Zone analysis" reports").
·Graduation of axis for "Measurement", "Time" or "Prints".
The reference values depend on the presettings (see Reference value in the "Progress" report).
•(7) Y axis:
·Graduation of axis for: Delta E / density color deviation in %
•(8) Color and print unit number
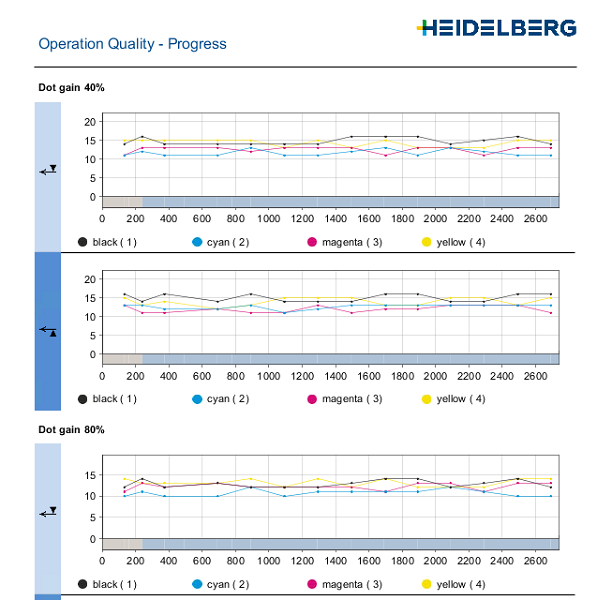
Dot gain (illustration below):
•Representation of the dot gain for all measured dot gains.
(1)
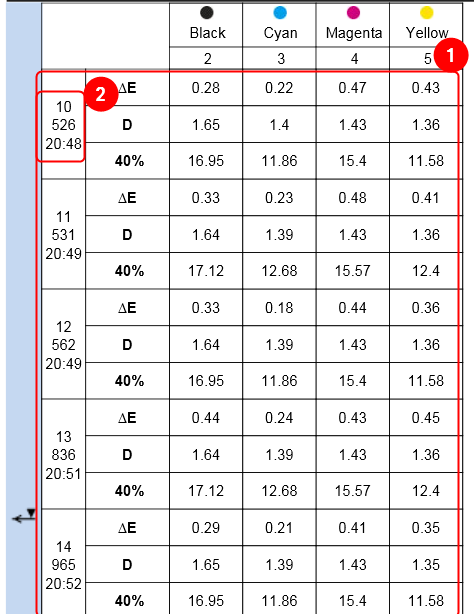
•(1) Single values:
Display of the measured values for dot gain, Delta E and density for each measurement.
The single measurements display only if this is enabled in the Presettings. See Presettings in Analyze Point.
•(2) Measurement details:
·Measurement number (first figure)
·Sheet number (second figure)
·Time (third figure)