The results of optimization display in detail in the "Results" step. You can only start a new optimization in this step or open the HTML report for optimization.
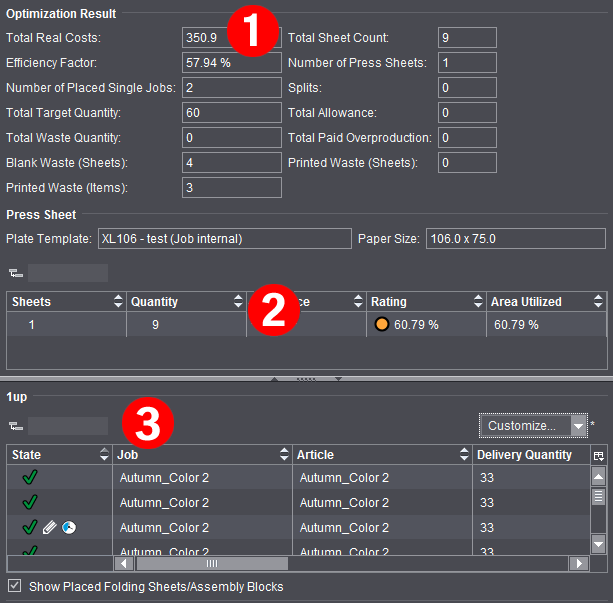
In addition to the results already shown in the "Optimization" step, you can view all other details of the analysis (1) as also found in the HTML report.
On the one hand, the tables display an analysis of the press sheets as per the rating criteria defined for optimization (2) and on the other a list of placed articles with details about delivery quantity, overproduction, waste, etc. (3).
See "Rating" Tab for a description of the press sheet details and rating.
In the "State" column, you can view the latest details about placement of all articles after each optimization run:
|
|
The article is optimized and placed on one or more press sheets. |
|
|
The article was not placed on one of the press sheets because it was set to "inactive". |
|
|
The article was not placed. There may be several reasons for this, like for example, the poor rating of a press sheet. You will find more details about the icons in Input List for Sheet Optimization (grouping table). |