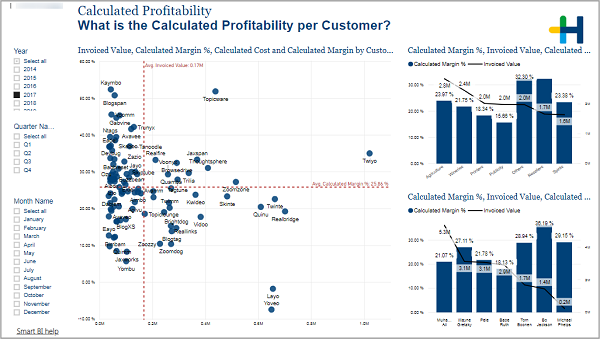
What is the Calculated Profitability per Customer?
(Change language of this page to: English, Deutsch)

This page shows you the calculated profitability for customers, customer groups and representatives. Its setup is identical to the page Real Profitability but instead of real values calculated measures are used.
On the left side you can select the time period that should be displayed. If you don’t select anything, the visuals show all years combined.
On the big scatter chart you can easily see which customers have an above or below average Invoiced Value and Calculated Margin %.
The two visuals on the right display the combined Calculated Margin % and Invoiced Value for customer groups and representatives, respectively.