Sheetfed makeready Y2Y by device
(Change language of this page to: English, Deutsch)
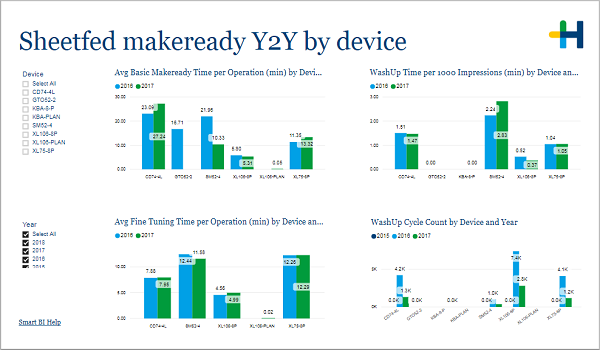
On this page you can compare key factors on a year to year level. It helps you to identify long term changes for each device.
....
If you are not sure about the meaning of some of the measures, go to A brief explanation of important measures in this report.
In the filter area on the left you can adjust which devices and years are included in the charts.
The four column charts show you the average basic make-ready and fine-tuning time per operation, the wash-up time per 1000 impressions and the wash-up cycle count for each device. The differently colored columns represent the selected years.
If you are more interested in a monthly comparison, go to the next page Makeready monthly by devices.