
Information about Long-term Analysis
"Analysis" lets you assess several color data sets created during a certain period. The results are shown in three different analysis reports and depict trends relating to changes. If you check a test chart or test strip at regular intervals, you can see how a process changes ("drifts off").
A time series analysis allows you to check whether and how changes in ambient conditions (e.g. humidity, temperature), the replacement of worn parts (e.g. rubber blanket), the use of different inks (e.g. from another manufacturer or a different batch) and different paper or fountain solutions can affect the process. You can judge as of what point the changes are critical and when linearization or calibration is necessary.
The results also show whether the changes are regular or whether they fluctuate and whether they are found constantly or appear only as of a certain point. You can also print the results out as a record (quality reports).
The file management function in "Analysis" lets you edit up to 15,000 data sets. Only the locations, dot gains and densities are extracted when a data set is opened and they are saved together with the path to the original file. This data format simplifies management and makes it easier to compare different elements.
For a long-term analysis, use the data of a process standard as the reference or select the measured data of a test chart or control element. Based on these reference data, you then compare other measured data of test charts or control elements either individually or all together (mean values) see 'Mean calculation of test chart data' Dialog).
You can change the data set combination and the data selected as the reference data as required. You can save the combined measured data as a series in xml format.
Series
All the data sets used for a long-term analysis are grouped together in one series. You can either compile a new series or open an existing one. Both options allow you to make any number of modifications within the series (adding other data sets, disabling or deleting data sets already in the series, changing the order or the reference). Use the "New", "Open", Add" and "Save" buttons on the right as well as the "Change entry" dialog that you can open by double-clicking an item in the data table.
The series is saved as an xml file.
The reference data set provides you with defaults for a comparison and overall assessment. A selected process standard (it has "P" as its "ID") is set by default as the reference data set. If you disable this process standard, the first data set (ID = 1) in the data table is then automatically used as the reference and "Ref" displays as its ID. You can change the reference data set as desired. Double-click an item in the data table to open the 'Change entry' Dialog where you can make the changes you want to the current data set.
You can define a maximum of four hot folders and their backup folders for the analysis results in the 'Hotfolder' tab in the "Preferences" dialog. In the reports in "Analysis", there are three elements to the left of the button bar (between data table and status bar) that are used to control how the hot folders are polled. The items in the hot folders are updated every 30 seconds. After the data in the hot folder are evaluated and displayed, they are copied automatically to their backup folder.
Note: In Image Control 1, the data for quality control (quality data) are stored in the "Results" folder (D:\cpc24\QualityMonitor\Results). This folder often has a large data volume because the quality data of different jobs are stored there and up to four presses can access this folder. For that reason, to have a better overview of your data, you should not define this "Results" folder as the hot folder. Select any other folder to which you can copy the data you wish to evaluate from the "Results" folder.
In the successor, Image Control 2, you can define any folder as the hot folder and enter the paths for the Quality Monitor output directory. You can then specify these hot folders also in Color Toolbox as hot folders for the analysis results.
How to use the hot folders
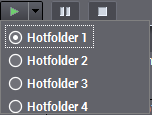
Use the right arrow beside the green Start button to open a list where you can select the hot folder you want by enabling the relevant radio button. You must have defined the location of this hot folder and of the backup folder in "Preferences > Hotfolder".
|
|
Polling of the selected hot folder starts when you click the green button. |
|
|
Polling of the selected hot folder is paused when you click the yellow button (Pause). Resume polling by clicking the green button. |
|
|
Polling of this hot folder stops when you click the red button. |


