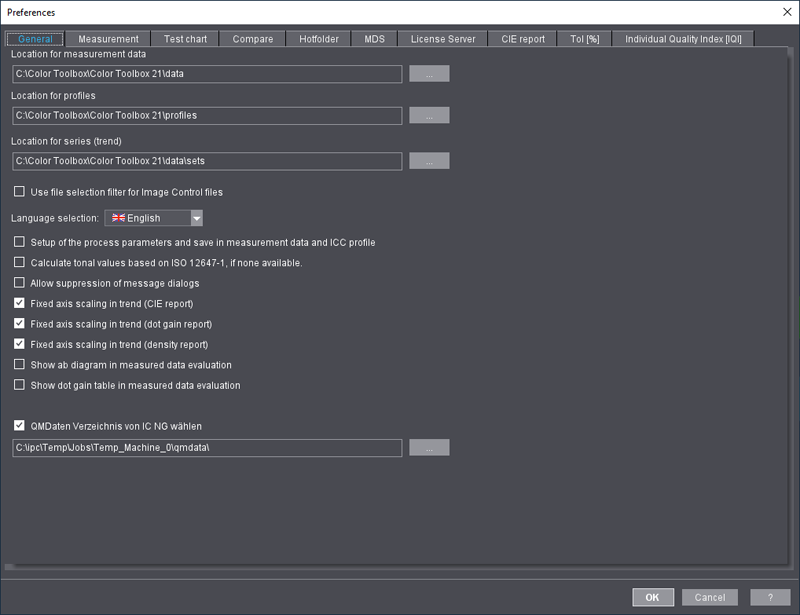
In the "General" tab, you can define the following settings:
•Define locations separately for color data files, ICC profiles and series (Open/Save).
Click the button with the three dots to change the default location and select the one you want for the data in the dialog that appears.
•Enable or disable a selection filter for files coming from Image Control.
When this function is enabled, the "Image Control Filechooser" window displays with six sorting criteria that you can use for fast file selection: "Machine", "Job", "Date", "Print", "Sheet" and "Element". Files created with Image Control are automatically given a name when saved and, as a result, have the necessary information for the sorting criteria. The names of color data files are broken down, and the identifiers are added to the relevant lists.

Note: You can also toggle between "Machine", "Job", "Sheet" and "Element" directly in the results when there is a connection to Image Control of Version 2021.10 and later (see Evaluation of Image Control Data).
•Select the language for the user interface.
Afterwards, you must restart the program.
•Switch to the easy mode.
Only the overall results of the quality assessments (reports and proof statistics) are displayed in the "Compare" main function.
•Enable the function for setting and saving process parameters.
If this function is enabled, you can enter process parameters and save them along with the measured data. Likewise, the process parameters and the measured data are saved within the generated ICC profile.
The dialogs for entering process parameters are disabled if the function is not selected, and process parameters are not saved along with the measured data.
Recommendation: Enable function
•Enable the function for calculating tonal vales based on ISO 12647-1 if there are no tonal values.
Dot gain is determined from measured density values. If no density values were measured and this function is disabled, you can calculate the density values from the spectral values or, if the latter were also not measured, by general approximation from the Lab (xyz) values.
Recommendation: Enable function
•Allow suppression of message dialogs
Messages that are issued when non-conform data are imported are suppressed when this function is enabled.
You can suppress further messages by checking the box in a message if this function is disabled.
•Fixed axis scaling in trend (CIE report)/Fixed axis scaling in trend (dot gain report) and/or Fixed axis scaling in trend (density report)
A fixed axis scaling instead of a dynamic one is used for all diagrams if this function is enabled. This lets you identify the analysis results more easily (especially for dot gain analysis) and compare them with each other.
•Show in "Measure" as well
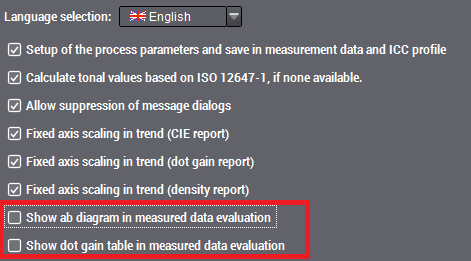
When these options are enabled, the ab diagram and/or dot gain table views are added to the "Measure" tab.
ab diagram: You can also view the ab diagram without having to first go to the "Compare" main function to do this (see 'ab diagram' View).
Dot gain table: This table is equivalent to the table that you can view in "Measure > Dot gain" in addition to the curve diagram when you drag the lower part of the view upwards (see Data Table) Because dragging the lower part of the view upwards causes the curve diagram to be squashed, it may be clearer to toggle between the two view modes for dot gain using the tab bar.
•Choose QMData folder of IC NG
As of version S22A_IC, the Quality Report replaces the Quality Monitor in Image Control. When Image Control is connected to Color Toolbox, you can continue using the full scope of Quality Monitor functions and refer to the new function to additionally analyze measurement data.
To establish the connection, you must specify the target folder for Color Toolbox QM data in the Preferences (Image Control default folder for external systems: "Quality Monitor output folder", not the "Analyze Point" folder). After having set the folder, you must restart Color Toolbox to establish the connection to the folder. You can then switch between the jobs directly in the extended view of Color Toolbox.
See Connection to Image Control for details

Note: The settings for color measurement (which values will be measured) and measurement conditions (density status, filter, backing and density display) depend on the device you use and are only possible in this dialog as they must be set before the instrument is initialized. Changes to the instrument settings will apply to the next document to be measured!
In the "Measurement" tab, you can define various preferences for measuring colors in documents:
Measurement conditions
•Spectral measurement conditions for CIELa*b* values compliant with the ISO-13655 standard: M0 (undefined, most of the old measuring devices), M1 (D50, daylight illumination), M2 (UV cut filter) or M3 (M2 + polarization filter)
Your selection does not affect calculations.
•Density status, e.g. ISO 5-3 Status T or Status DIN16536 (NB). Your selection impacts some calculations.

Note: If you change the type of filter in the "Color measurement" dialog, this change is applied automatically to the Preferences.
•White or black backing. Your selection does not affect calculations.
•Density display (absolute or relative). Your selection impacts some calculations.
Measurement - Options
•Remember last instrument used
When this option is enabled, the last instrument used is used for the next measurement.
•Which color data are to be measured and saved to the data file?
Normally, XYZ and Lab values are measured. Optionally, density and/or spectral values (remissions) can also be measured if this is supported by the device.
•Show a message if an inconsistent density status is found when you open a file?
•Check spectral remission values
Measured spectral data must be normalized for further evaluation. Peaks above 100% can occur in the UV<->Blue range. This can be caused by the measuring device whose calibration or printing material (especially papers with UV optical brighteners). In such cases, you cannot distinguish whether or not the data are correct or whether errors occurred because of incorrectly calibrated or defective instruments.
When this option is enabled, the input spectral data are examined closely and the tolerance for peaks above 100% is kept very small. This prevents the use of faulty data, although correct measured data may also be rejected in the process.
•Show message if the density status of the loaded file does not match
The default status (see above) is always used as the density status in Color Toolbox. For example, if a color data file you open has a different density status, you will see a suitable warning if this option is enabled. When an edited file is saved, it is always saved with the density status of the preferences of Color Toolbox.
If several measuring devices of one type are available through the network or USB, this is where you can select the device you want to use for the measurements. After you click "Refresh", all available measuring devices of this type are presented for selection in the list with details of their serial number and type of connection. You can toggle between different types using the tabs.

Note: At present, this selection option can only be used for Konica Minolta FD-9/MYIRO-9 measuring devices.
Color Toolbox supports a wide range of colorimeters. Following the introduction of the new ISO 13655:2009 standard, all manufacturers brought out new measuring devices that work in compliance with this standard. The disadvantage of the large number of measuring devices supported by Color Toolbox is the long list of devices for selection in the measure function. If only one measuring device is used, you can work around this issue by enabling "Remember last instrument used".
However, if you use several measuring devices, we recommend that you match the "Preferred measurement devices" list to the devices you use. For example, you can click "Deselect all" and then enable only the measuring devices that you really use. In the measure dialog, the list of measuring devices then only has those devices that you enabled in the preferred list and as a result is much clearer.
Like you did in "Measurement" for the measuring devices, in the "Test chart" tab you can set which test charts will display in the selection dialogs to confine the lists to the test charts that you actually use and, by doing so, to keep the lists clearer.
The other two tabs let you make the same preliminary selection also for control strips and linearization strips.
In the lower section, you can set which test chart will be used as the default in the list boxes. This makes your work easier if you use one test chart more frequently than others.
To set this, first choose between "Test chart", "Control strip" or "Linearization strip" as your test chart type and then set the standard you want and the type. The box on the right displays a preview of the test chart for easier detection.
More details about the available test charts:
•General information and descriptions of the test charts: Test Charts and Control Strips
•Overview of the Control Strips
•Overview of the Linearization Strips
In the "Compare" tab, you can select a color data file or an ICC output file that has measured data. When the application launches, this file loads automatically as the reference file in "Compare".
You can either enter the file name with its full path in the text box or click the three dots to the right of it and select the reference file from the "Reference file for comparison" dialog. The file name with its full path is automatically entered.
In the "Hotfolder" tab, you can select a total of four different folders and their backup folders. These hotfolders are monitored in "Analysis" and can be started for the analysis results. After the data in the hot folder are evaluated and displayed, they are copied automatically to their backup folder.

Note: In Image Control, the data for quality control (quality data) are stored in the "Results" folder (D:\cpc24\QualityMonitor\Results). This folder often has a large data volume because the quality data of different jobs are stored there and up to four presses can access this folder. For that reason, to have a better overview of your data, you should not define this "Results" folder as the hot folder. Select any other folder to which you can copy the data you wish to evaluate from the "Results" folder.
If you are working with the new Image Control, you can set any output folder for the quality control data in "Service > Integration/System > Prinect Configuration". Write permissions are required for this folder.
In the "MDS" tab, you can define settings for editing process standards.
HEIDELBERG introduced the "Master Data Store" (MDS) to centralize common software resources to enable their general integration. The MDS is one of the PIL components (Prinect Integration Layer) which the Messaging Service and the JDF Storage Service are also part of.
An MDS server is always installed (locally) along with Color Toolbox.
The Calibration Manager process curve sets (aim curves) are used if you enable "Use tonal values from Calibration Manager". You can set your own custom dot gains, tolerances and spreads if the box is not checked.
By enabling the appropriate radio button, you can choose whether the process standards will be saved locally or in the MDS (Master Data Store). You must enter the name and port of an external MDS server if you wish to save to it. You can test the connection with the appropriate button. The Calibration Manager dot gain values are always used when process standards are saved externally.

Note: You must restart the application if you switch to MDS.
Process standards that are saved locally can be sent to the MDS where they can then be evaluated when you click "Migrate local process standards".
You can edit and save a process standard in the "Process standard" main function. All changes can be written back to the MDS.
Migrate local process standards
You can migrate process standards that are stored locally if you wish to make them available in the external MDS.
To do this, you must first set up a connection to the external MDS. Proceed as follows:
1.Select "Save process standards in the Master Data Store".
2.Enter the computer name on which the external MDS is located.
3.Test the connection, if necessary.
4.The "Migrate local process standards" button is now enabled. Click it to open the "Process standard migration" dialog.
5.Select all the process standards that you wish to migrate by checking the appropriate boxes.
6.Click "OK" to start migration. The dialog closes.
The migrated process standards are now available on the external MDS.
MDS backup
You can import and export the MDS with the "Add or Remove Programs" dialog (in the Control Panel).
The following options are available after you select "HEIDELBERG Prinect Master Data Service 2.5.36.7" and click "Change/Remove":
•Restore/Import: This option lets you restore the master data archives (current MDS data will be replaced) and/or import the master data to the Master Data Store (will be added to the current MDS data).
•Archive: You can select the Master Data Store in a master data archive with this option.
•Remove: This option lets you remove components that were installed by the HEIDELBERG Prinect Master Data Service (only for a full uninstall).
You can select a different License Server in the "License Server" tab.
•Server: This displays the name of the currently used License Server.
•New Server: This is where you enter the name of the License Server you want.
•License Information: This displays the name and location of the license file used.
•Apply: If the new License Server is available, it is used after you click "Apply".

Note: You can find more details in the License Manager User's Guide and Help.

Note: A restart is not necessary after a change in license.
In the "CIE Report" tab, you can define which data will be shown in "CIE report" (in the "Compare" main function) by checking the boxes you want:
•Show/hide dot gain at 25%
•Show/hide dot gain at 40%
•Show/hide dot gain at 50%
•Show/hide dot gain at 70%
•Show/hide dot gain at 75%
•Show/hide dot gain at 80%
•Show/hide density values
•Show/hide CIELAB color values
•Show/hide analysis
•Show/hide proof report
The sections you selected are shown even if they have no data. For a better overview, these sections (except for "Total results") are minimized to a caption bar and can be shown or hidden by clicking this bar.
In the "Tol [%]" tab, you can enter tolerances for the "Ink zones" and "Gradual fading" views in the "Measure" main function.
The tolerance range of the process standard is green in the views and can be hidden.

Note: These tolerances for ink zones and gradual fading do not refer to the process standard when you assess density. This is where you define a threshold that refers to an evaluation diagram that displays for the single views (see Show density in ink zones and Show density in gradual fading).
Each single view of the ΔE evaluation displays the process standard tolerance for the color you selected.
'Individual Quality Index (IQI)' tab
In the "Individual Quality Index [IQI]" tab, you can set custom values for weighting the quality criteria (dot gain, ΔE and gray balance).
The valuation system is applicable for all the available process standards, "CMYK", "Multicolor" and "Spot colors". The IQI system (scoring model) provides a systematic method for the comparison and valuation of the quality level of your print production. All decision-related criteria are listed and weighted in this process; each property of the features is assessed using points. Scoring models try to quantify quality and subjective expectations and make them comparable.
The sum of all single values (Scoring) produces the index (Maximum Value). This includes color values, dot gains, paper white and gray balance.
The default value is 3.0. Values ranging between 3.0 and 4.0 make sense. The permissible values for the evaluations lie between 0 and 10.
"Gray balance" displays the tolerance for the gray balance check within the process standard check (displays for your information only; you edit the gray balance parameters in the "Process standard" main function in "Show gray balance parameters", see Show/Hide gray balance parameters).

Note: If the factors evaluated by IQI are not complied with in the color control strip or minispot you are checking, as for example in the "Prinect 4GS" strip, the maximum value that is possible is automatically matched accordingly.
Example for setting the individual quality index
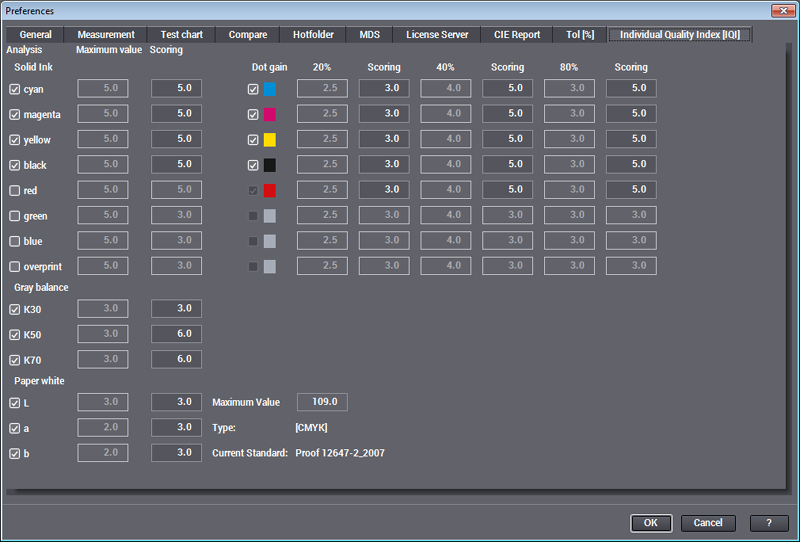
Compilation of the maximum value for IQI in the "Preferences"
The maximum value is the sum of all enabled single valuations:
•Scoring for "Solid Ink", 5.0 each for cyan, magenta, yellow and black results in 20.
•Scoring for "Dot gain" (20%), 3.0 each for cyan, magenta, yellow and black results in 12.
•Scoring for "Dot gain" (40% and 80%), 5.0 each for cyan, magenta, yellow and black results in 40.
•Scoring for "Gray balance", 5.0 each for K30, K50 and K70 results in 15.
•Scoring for "Paper white", 3.0 each for L, a and b results in 9.
This results in a maximum value of 96 that displays below in the middle of the dialog. In addition, the "Type" and the currently set process standard also display.