You get detailed information on the respective operation in the following tabs:
Which parameters need to be defined?
In order to be able to generate operation information, you must select an operation in the job/operations list.
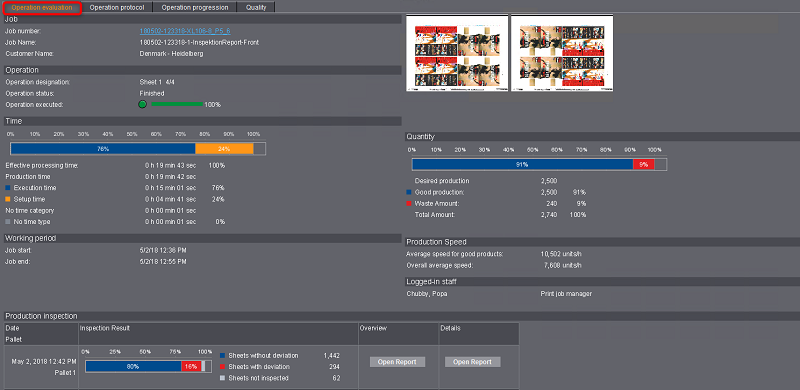
The " Operation evaluation" tab offers detailed information about a selected operation. Various information displays, depending on the type of the operation (Printing, Digital Printing, Folding, Trimming, etc.). The following screenshot shows an operation evaluation example of a Printing operation.
The following information displays in the operation evaluation:
"Job" group
The respective job is displayed here. You can switch between the different job views with the context menu of the job number hyperlink.
"Operation" group
This displays details about the selected operation.
Sheet preview
This shows you a sheet preview.
The bar chart shows the percentage ratios of the production times. Here, the individual production times (percentages) always refer to the effective working time.
Effective processing time = sum of all times in which an operation was loaded on a machine.
The absolute and percentage production times display again separately below the bar chart.
The classification and capture of times depend on how you have configured the time categories and time types in the Device Configuration. See Time Category.
"Quantity" group
The bar chart displays the percentage of the operation already executed. The overall amount and the good sheets and waste produced are again shown individually below the bar chart in absolute values and as percentages.
•Good production
Number of printed sheets while the good-sheet counter was switched on.
•Waste Amount
Number of printed sheets while the good-sheet counter was switched off (e.g. during the setup of the machine).
•Quantities for Versafire presses
Number of printed copies (e.g. flyers, 1ups, etc.)
"Production speed" group
•Average speed for good production
Good production / sum of all times in which good sheets were printed (good-sheet counter was switched on and machine really printed).
Times in which good sheets were printed cannot be read off directly in Analyze Point.
•Overall average speed
Good production / report period in hours (h)
The report period is the period that was selected above the report (e.g. "Today", "Yesterday", "Current Month", etc.). The report period must not be mixed up with the operating period. The latter does not include the times in which the machine was switched off.
Production Speed Labelfire
Average speed in meters/minute.
"Logged-in staff" group
All employees who participated in this operation are listed here.
Impressions (ColorImpressions and BlackImpressions)
"Impressions" designates the number of pages in digital printing. One "Impression" is one printed surface of a sheet. A distinction is made between ColorImpressions and BlackImpressions: ColorImpressions are all impressions that contain at least one color. BlackImpressions are Impressions that contain only black.
Number of Plate Changes
Shows the number of plate changes for all Prinect Press Center machines with automated plate change. Counting of a plate change starts as soon as a plate is loaded.
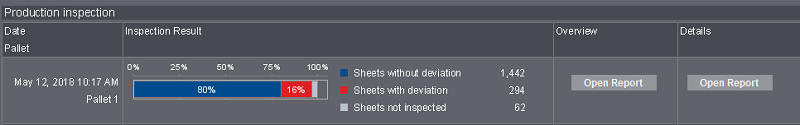
Production Inspection is available for printing presses with Prinect Inspection Control 2.

Prerequisite: The "Enable import of inspection data" option must be enabled in System Preferences. Set this option in "Administration > System > [Prinect Server] > Analyze Point service > Inspection Reports > Properties". See "Analyze Point Service" section.
During production inspection, Prinect Inspection Control 2 performs an ongoing comparison of printed sheets with a "digital reference sheet" created in the machine. The objective is to check each sheet in order to prevent misprints during production.
The reports are transferred to Analyze Point as soon as a job was finished at the press, a job change took place, or the press operator triggered a report manually.
|
Column |
Description |
|---|---|
|
Date Pallet |
•Date and time of the measurement •Pallet No. |
|
Inspection Result |
The bar chart shows the percentage evaluation of the Production Inspection. All sheets after you switch on the good sheet counter are considered. •Sheets not inspected •Sheets without deviation •Sheets with deviation |
|
Overview |
The "Open Report" button lets you view a PDF report with a summary of production inspection. See Overview of production inspection report . The button is grayed if the reports have been deleted. See Report buttons are grayed. |
|
Details |
The "Open Report" button lets you view a PDF report with all deviations found during production inspection. The first three pages are identical to the overview report (see Overview of production inspection report ). The following pages list all deviations with a picture and a mark each. •The report may have gaps. See Gaps in the "Details" report. •The button is grayed if the reports have been deleted. See Report buttons are grayed. |
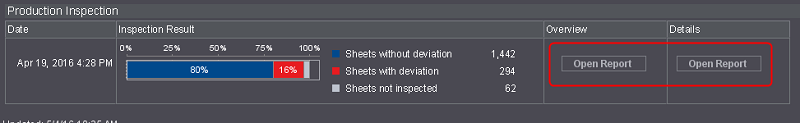
Grayed buttons for reports indicate that a database is too full. If a database is too full, the system will automatically delete old reports, and you cannot open them any longer in Analyze Point. You can check in the system settings if the database is full. To do so, go to "Administration > System > [Prinect Server] > Analyze Point service > Inspection Reports".
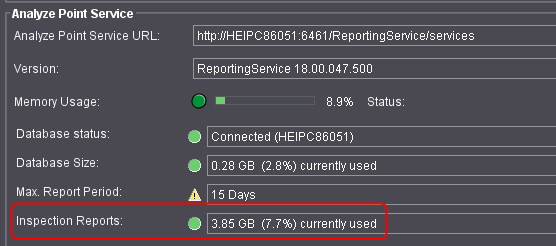
The status icon is yellow if the database is full. You need a larger database if you wish to store older reports for a longer period of time. Contact Prinect-Service in such a case.
Overview of production inspection report
The image below shows an example of a production inspection report.
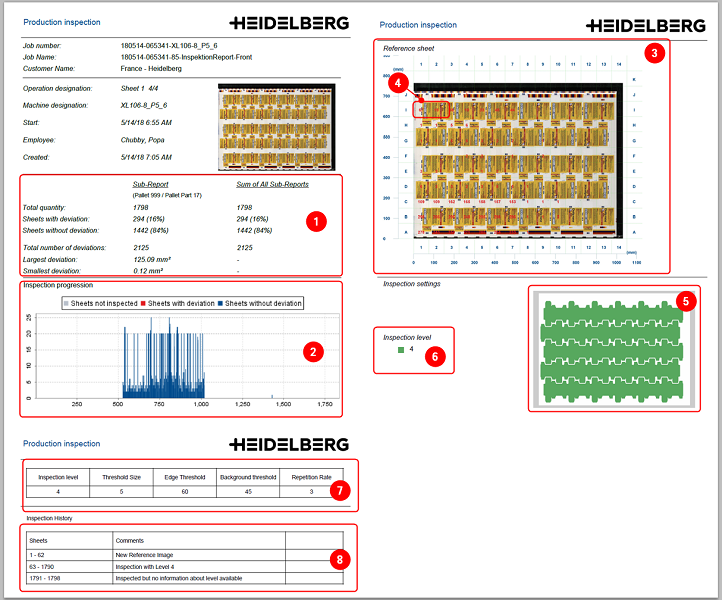
•(1) Summary of inspected sheets.
•(2) Inspection progression (histogram)
The chart shows how many errors per "Sheets with deviation" were detected (X-axis = sheet number; Y-axis = number of errors). A maximum of 100 errors are displayed because a maximum of 100 errors are transferred.
•(3) Image of the digital reference sheet split into several quadrants (A1, B1, C1 etc.).
•(4) A red number in the quadrant indicates the number of deviating sheets in this area. Each deviation can be tracked in the Detail Report.
•(5) Areas that were inspected.
•(6) Level of inspection severity.
The smaller the number, the higher the more accurate was inspection carried out. Values from "1" to "5" are possible.
•(6) Measurement settings of the inspection system.
•(7) Remarks on the sheet.
The right-hand column indicates the number of the sheet ID in case of presses with ink jet-based "CodeStar". This is the number of the first sheet of the inspection interval. A sheet containing errors or deviations can be clearly identified with this sheet ID.
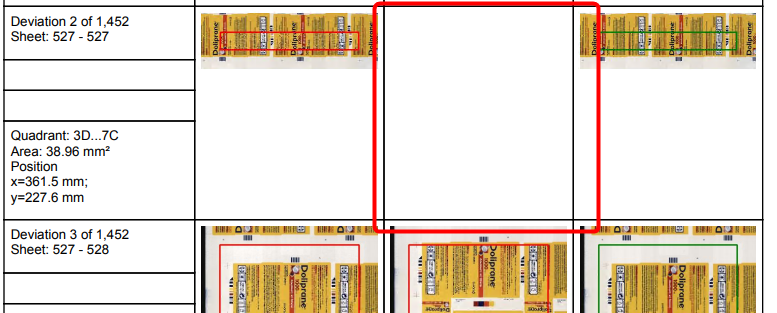
Detail report of production inspection
You can precisely track the deviations in the Detail Report. The first three pages are identical to the overview report (see Overview of production inspection report ). The following pages list all deviations with a picture and a mark each.
Pictures may be missing in the list of deviations. This is because the report file size is limited. The Inspection System will not write all the images to the report if the number of deviations is too high.
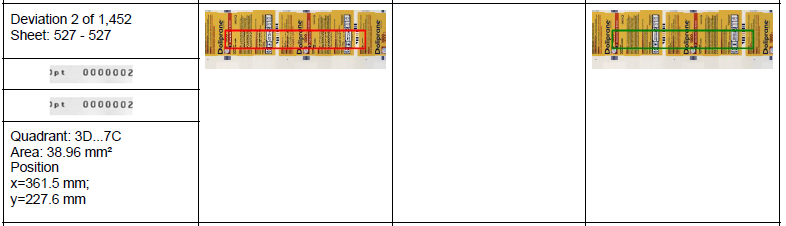
Sheet marking by ink jet-based CodeStart
Presses equipped with the ink jet-based "CodeStar" sheet marker at the feeder mark or number all sheets consecutively. This makes it possible to fully track the material in security printing. The camera of the inspection system scans this sheet mark. The Report indicates the first and the last sheet mark of the inspection interval.
This report is available when a Prinect Inspection Toolbox is used.

Prerequisite: The "Enable import of inspection data" option must be enabled in System Preferences. Set this option in "Administration > System > [Prinect Server] > Analyze Point service > Inspection Reports > Properties" (see Administration - System).
During PDF inspection, the Prinect Inspection Toolbox compares a scan (from Prinect Inspection Control or Prinect Image Control) with the imposed layout PDF/TIFF document from prepress. PDF inspection acts as an ok-for-press and makes sure that the content of the print job matches that of the customer job.
The report is submitted to Analyze Point as soon as the Inspection Toolbox operator approves or disapproves of a sheet.
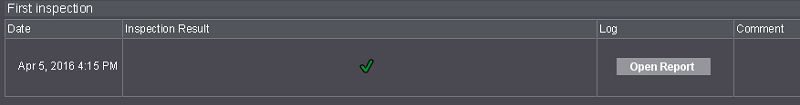
•"Inspection Result" column
The column indicates the Inspection System operator's evaluation of the press sheet. This is a manual evaluation independent of the deviations found by the Inspection System. If the sheet has not been approved (red cross), there may be a press operator's note in the "Comment" column.
•"Log" column
The "Open Report" button lets you view a PDF report of PDF inspection. The report lists all the deviations the Inspection System has found. The layout of this report resembles that of the Production Inspection report. See "Production inspection" group.
•Report buttons are grayed
See Report buttons are grayed.
•Comment
This column contains important notes by the Inspection System operator. They are particularly relevant for press sheets that were not approved.
This report is available when a Prinect Inspection Toolbox is used in combination with Prinect Image Control.

Prerequisite: The "Enable import of inspection data" option must be enabled in System Preferences. Set this option in "Administration > System > [Prinect Server] > Analyze Point service > Inspection Reports > Properties". See Administration - System.
During the sheet inspection, the Prinect Inspection Toolbox verifies two scans from Prinect Image Control. The first scan from Prinect Image Control is used as the reference. All subsequent scans are compared with the reference. The objective of sheet inspection is to detect permanent print image faults such as defective plates or blankets.
The layout of this report is identical to that of PDF inspection. See PDF inspection.
This is where you can view details about the operation in tabular form. This means that messages that are generated during an operation (automatically by the machine) are displayed in a chronological order.
|
Group |
Description |
|---|---|
|
"Job" group |
Information regarding the job: •Job number •Job Name •Customer Name |
|
"Operation" group |
Information regarding the operation: •Operation designation •Operation status •Operation executed Good sheets percentage of the planned good sheets printed so far Table for operation protocol: see Protocol contents (table). |
|
Sheet preview |
Sheet preview of the selected operation. |
Groups
|
Column Name |
Description |
|---|---|
|
Start |
Date and time of the operation start |
|
End |
Date and time of the operation end |
|
Duration |
Duration of the action. Time can be displayed in industrial time or standard time. See Presettings in Analyze Point. |
|
Action |
Number and name of the action as defined in Device configuration. |
|
Work type |
Work type reported at the machine. |
|
Cost center number and machine designation |
Cost center and machine name. |
|
Good Web Length (m) and Waste Web Length (m) |
Consumption of the Labelfire Digital Press. |
|
Print job manager |
Second and first name of the responsible machine operator and the assistant logged in. The print job manager is identified with an asterisk (*). |
|
Quantity and waste |
Details on the quantity of good sheets and waste sheets produced during the operation. |
|
Comment |
Comment recorded when the action is reported. |
Protocol contents (table)
Toggling Between Industry Time and Standard Time
See Presettings in Analyze Point.
Changing the Sorting Order of Actions
See Presettings in Analyze Point.
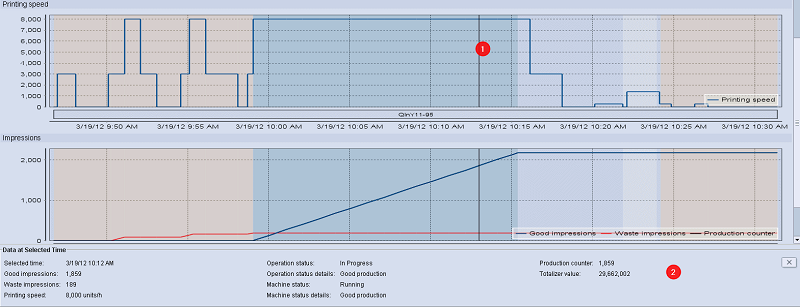
This is where you can view details about the following progressions in graphical form.
Printing speed/speed
Indicates the printing speed over time. Speed is not displayed for digital presses and Data Terminal machines.
Impressions/production counter
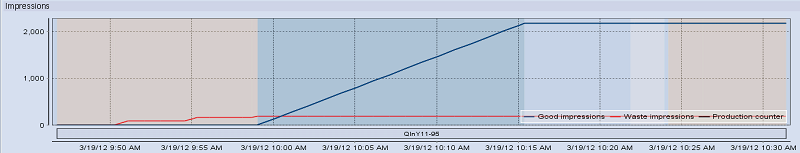
The chart shows the good impressions, the waste impressions, and the production counter over time. Instead of the good sheets, the production counter displays the number of completed press sheets. For example, if a press sheet with front and back is printed in two operations (work-and-turn), then the number of good sheets is practically double the amount shown in the production counter.
Details about a certain time can also display below the graphic charts. See Selecting a certain point in time.
Meaning of colors in the chart
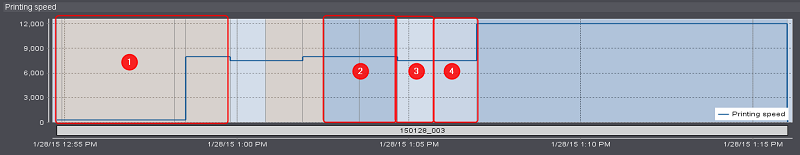
The background of the two graphic charts is shown in different colors. The color depends on the machine status within a certain time frame.
•Orange = Setup (1)
•Blue = Good production (2)
•White = Washup (3)
•Light blue = Idle (4)
All other machine statuses are shown in red.
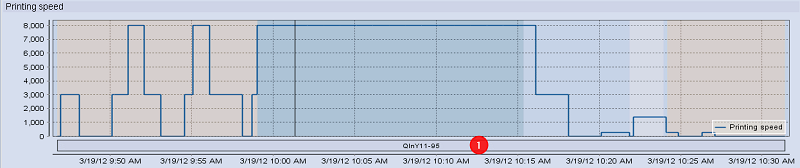
Broken bar
Below the progressions there is a bar with the job number. This bar is shown as broken if the operation was interrupted (1). The bar is not interrupted if the machine is switched off (graphic below (1)). In both cases, the counter readings "go" vertically to "0" at the time of the interruption/shutdown.
Machine switched off
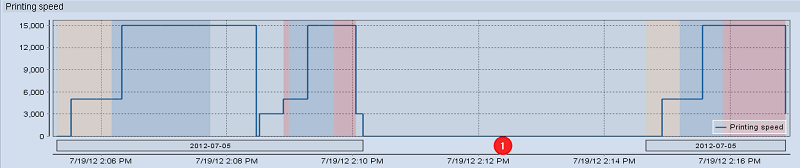
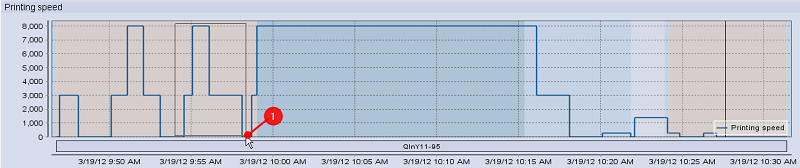
Selecting a certain point in time
You can click on any point of the curves using the mouse. A vertical line then appears at this point in all graphic charts (1). More detailed information (such as good production, waste, and the speed) is displayed for the selected point (2).
Click the "X" button to reset the selection of a point. The more detailed information is then hidden again.
Zooming in a certain section
If you wish to take a closer look at a certain area, you can zoom in on this area. Zooming in on individual areas is done separately for each progress curve.
1.To do so, click in the top left-hand corner of the desired starting area with the mouse and hold down the left mouse button.
2.Now draw a rectangle to the desired lower right end position and let go of the left mouse button.


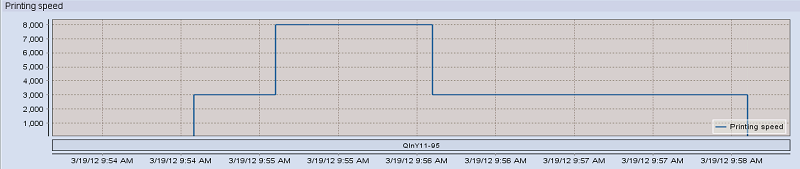
Zooming out from individual areas is done separately for all progress curves.
To zoom out, click on the progress curve with the mouse, hold down the left mouse button and move the mouse upward to the left. Now release the left mouse button.