The list window shows you the contents of the currently selected job as a table.
The list window has five different tabs. All of these tabs show you job data as tables. You can also start many different actions with the implemented Context-sensitive Menu.
You edit the column setup of the table by right-clicking the header; the list-specific functions are invoked by right-clicking an item in the list.
If a job has several product parts, only the content of the currently selected product part is shown in the "Press Sheet" and "Folding Sheet" tabs. The "Page List", "Assigned" and "Not assigned" tabs refer to the job and show you data relating to the whole job.
The list window is designed primarily for the creation of product part or job reports and is also a supplement to the Browser and graphic window. It shows parameters such as format, paper size, etc in tables.
You can decide on the parameters you want to show in all the tabs of the list window. You can also show and hide hierarchy levels and edit columns:
Context-sensitive menu functionality
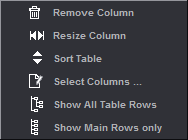
Table setup (context-sensitive menu on the header)
Display the context-sensitive menu by clicking the header with the parameter names:
•Click "Select Columns".
•The table that now appears lets you configure the list as you want it.
The left column shows you all the parameters that can be displayed, for example, in the "Press Sheet" tab. The parameters tagged by an asterisk cannot display in the active open job. The right column lists the parameters that are actually shown.
1.Select a parameter in the left column and click "Add Column". The parameter appears in the right column and is shown afterwards in the list window.
2.Below the right column are arrow keys that you can use to define the order of the parameters going from left to right. The first parameter then appears on the left in the list window.
3.Quit the dialog by clicking "OK".
4.Taking the parameters configured in the screen shot above, you will now see the parameters in your list window as follows:

•You can create your own column with the "Add Mark" function. You can define the data that is to appear in this column using custom text marks with placeholders. More details can be found in Job (Attributes) .
•You can view different parameters in each tab. You can find more about which parameters you can view in the various tabs in the descriptions below.
•You can hide the list window permanently if you want. If you want a bigger graphic window, deselect the "List View" option in "File > Preferences > User Interface". The setting does not affect an open job.
•For versioned jobs, you can display the "Version Name" and "Version Description" columns in the list of press sheets and folding sheets. The version name and version description contain all the versions found on the press sheet. As usual, these columns are tagged by a (*) in the column selection dialog if they are not relevant for the current job (non-versioned job). The texts in the columns are identical to the marks placeholders $[VersionName] and $[VersionDescription].
•For jobs with sheet optimization, you can also view the rating criteria that were defined in "Sheet Optimization Setup > Advanced Settings > Rating" tab as columns in the press sheet list (see "Rating" Tab for more details). Each column then shows the related status icon and percentage. Only those table columns whose rating criteria are also enabled in this job display. In the case of the "Multiple 1ups" rating criterion, the same number of columns as the number of delivery quantity criteria defined for the multiple 1up display.
Context-sensitive menu on items in the table (all lists)
You can display the following functions in each context-sensitive menu by right-clicking an item in the list:
"Save Table as HTML Report ..."
You can save the listed information (tables) as a HTML file (for checking purposes).
You can define preferences for the content of the file in "File > Preferences > Reports". See Reports .
In addition, you can attach report files, report marks and GIF files (e.g. company logo) for a more complete picture in the "Save Table as HTML File" dialog that appears.
Report Header: Image data: You can define report marks as comments for image data.
Footer: You can define report marks as footers.

Note: More information about how to create simple HTML reports can be found in Creating Simple HTML Reports When Evaluation Problems Occur in the WST Barcode Reader
"Save Table as PDF Report ..."
Lets you save the listed data (tables) as a PDF report for checking purposes and documentation.
"Print Table..."
Prints the listed information (tables) to a printer.
"Transfer Table Setup to Server"
"Transfer Table Setup of All Tables to Server"
The column setup of the list view can now be sent from each Prinect Signa Station to the Prinect Signa Station server and Prinect Signa Station GangServer. You can send the table setup of one specific list view or you can send the table setups of all list views at one go to the server.
This means that the table setting used for the report no longer has to be set up directly on the Signa Station server but can be done on any workstation and then sent to the server.
A dialog displays where you can select the server if several servers are available. If only one server is available, this is selected directly.
After you select the server and click "Send", the table setup is sent to the server and as of then is available to the server.
Transfer of the table setup to the server requires that the Prinect Signa Station server and Prinect Signa Station are set to the same workspace.