Key factors for Operators - Waste
(Change language of this page to: English, Deutsch)
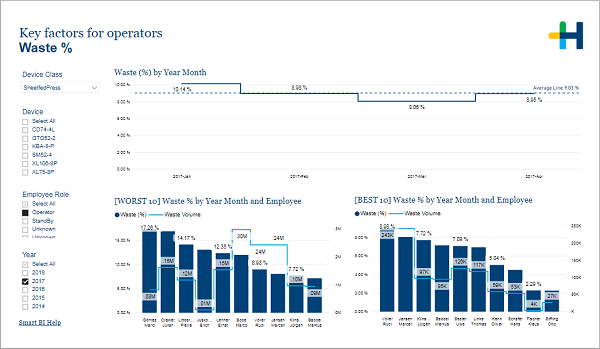
This page shows you the operators that produce the highest and the lowest waste percentage.
This page helps you to find which operators have the biggest positive or negative impact on the key factor waste percentage.
In the filter area on the left you can adjust which devices and years are included in the charts.
In the first chart you can compare the combined waste percentage for all operators with the average waste percentage of the selected time period.
The two charts below show you a ranking of the operators with the highest and lowest waste percentage results. Keep in mind that the waste percentage values are calculated over all selected devices and thus could not be comparable. Hover over an operator to get more information on the course of the waste percentage over time and for different devices or see the page Operators ranking - map of speed and waste to check if the results of an operator vary significantly from the others on the same device.
Got to page Operators ranking - map of production to check if you utilize the workforce of your best operators effectively.