You can open this view by clicking the "Dot gain report" tab.
Dot gain is the enlargement of screen dots by the printing process. An image can thus appear darker and/or a color shift may occur.
Normally, dot gain is measured in the midtones at 40% and in the shadows at 80%. These percents are mandatory for process standards. In Color Toolbox the dot gain can be specified in steps of 10% and in addition for the two checkpoints 25% and 75%.
The dot gain curves or printing characteristics are calculated on the basis of real density values if you also measure the density when measuring the colors.
If you don't, the density values are calculated from the spectral values or, if the latter were also not measured, by general approximation from the Lab(xyz) color values.
Dot gain is the difference between the tonal values before and after processing. It can also be negative (dot loss).
An analysis of this view will give you usable results only if the dot gain curves can be calculated from measured densities and/or spectral values.
For that reason, you should always enable the two respective options in "Preferences > Measurement":
•"Measure and save density values as well (if supported by instrument)"
•"Measure and save spectral remissions as well (if supported by instrument)"
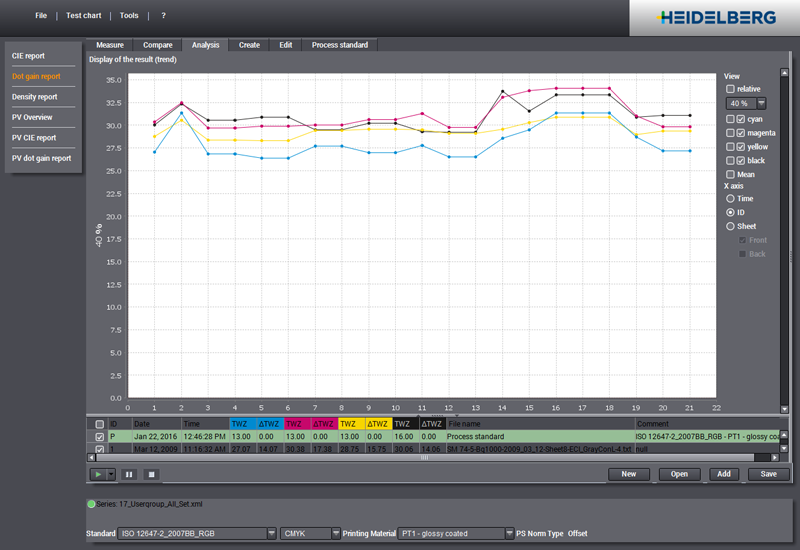
Display of the result (trend)
This shows you information that is applicable for all analysis reports:
•Information about Long-term Analysis
The result gives you an overview of the measured data during a certain period.
Display
In "View" you can show and hide the single color channels and tolerances like in "CIE report".
You select the checkpoint you want for dot gain (in steps of 10%, also at 25% or 75%) in the list. Normally, evaluation is at 40% and 80%. These percents are mandatory for process standards.
If there are dot gains for the selected checkpoint, the values display in the table in the "Dot Gain" column for all the colors in the measured data. The dot gain difference ("ΔDot Gain") is also listed in each case.
The "relative" list box gives you two display options:
•"relative" disabled: The dot gains (Dot Gain) display, depending on whether you selected "Time", "ID" or "Sheet" for "X axis".
•"relative" enabled: The dot gain differences (ΔDot Gain) display in relation to the reference (process standard or reference data set) for "Time", "ID" or "Sheet".