
Prerequisite: The prerequisite for the generation of the productivity diagrams is the evaluation of the automatically generated PDC messages "Job start", "Good sheet counter" and "Job end" of the press.
You have the following productivity evaluation options:
1.Automatic and precise evaluation of the machine productivity.
2.Detailed analysis of every connected pressed in a selected period:
·P-N diagram (speed related to quantity)
·T-N diagram (production time related to quantity)
·Table view on productivity
3.Comparison of all machines.
4.Identification of special jobs.
5.Productivity development and trend progression.
The Heidelberg Business Consulting team offers you custom support for the analysis. Besides an analysis of your own machines, "Performance Benchmarking" is also offered. This lets you compare your productivity with other print shops anonymously.
Generating a Report for Machine Productivity
Compared to other Machine Reports, you can select several machines for the Machine Productivity, e.g. if you wish to compare several machines. For this reason, the process of generating a report is different here.
Proceed as follows to create a Machine Productivity Report:
1.Go to "Analyze Point > Machines".

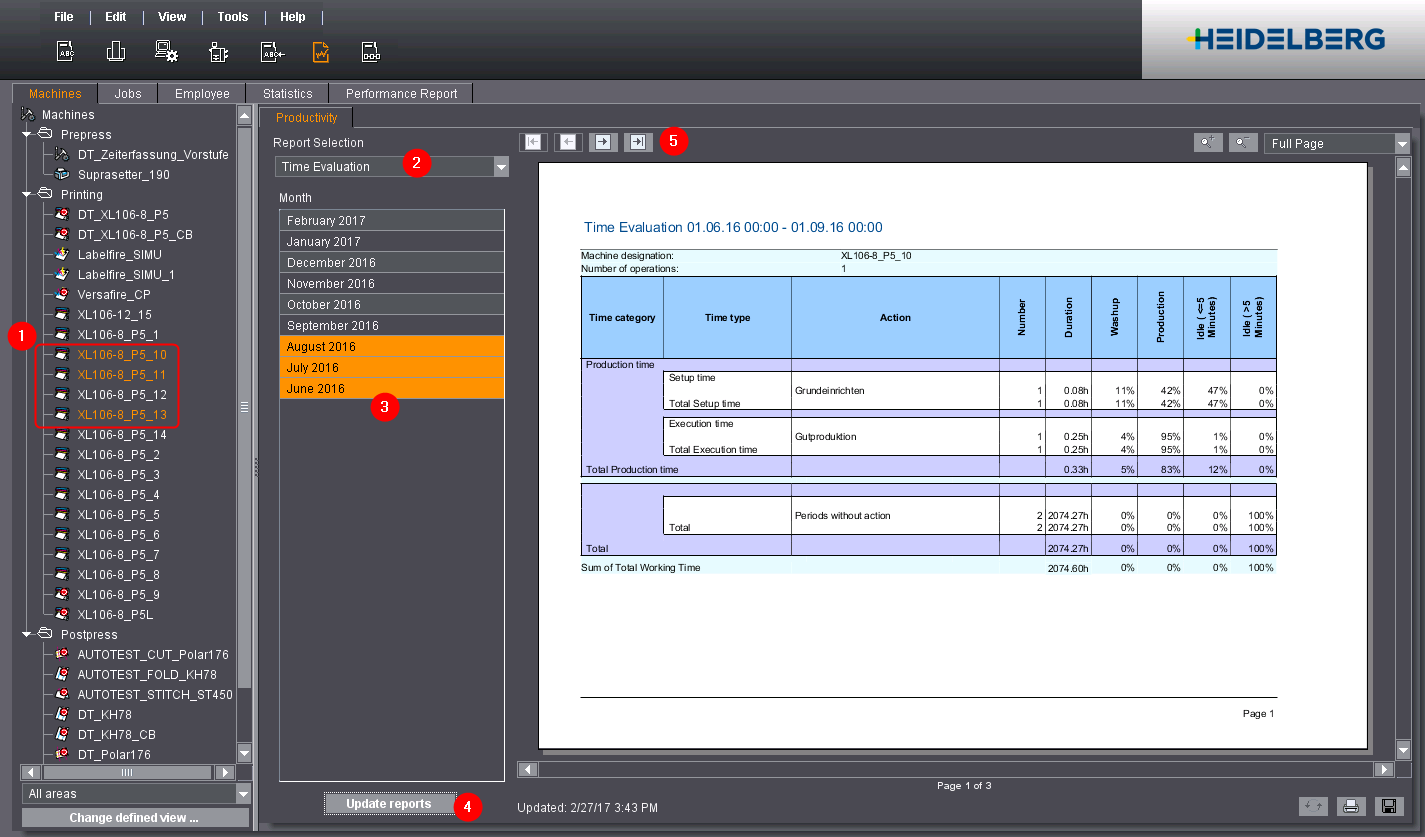
2.In the tree view to the left, select the machine for which you would like to generate a report (1).
For multiple selections, hold down the Command or Ctrl key and click the machines you want one after the other. The right side will then only display the "Productivity" report.
3.Select the Report to generate from the "Report Selection" list box (2).
4.Select the period of time for which you want to generate the Report (3).
·Only those months for which data is available are displayed (depending on the selected machines).
·Only months are displayed if the report can be displayed for the selected machine. For example: a speed index cannot be calculated for Data Terminal devices without counter box.
·For multiple selections, hold down the Command or Ctrl key and click the machines you want one after the other. You may select only contiguous months.
5.Click the "Update reports" button (4).
The report is generated and displayed on the right side.
If multiple machines are selected, you can use the arrow buttons (5) to go to the next machine (necessary only for some reports).
First, select the criterion that you want to evaluate (1).
With the Print button you can print all the productivity reports.

Save to a PDF file
You can save all the productivity reports to a PDF file with the Save button.

Section Saving the reports in a PDF file gives more detailed instructions.