 Prerequisite: The prerequisite for the generation of the productivity charts is the evaluation of the automatically generated PDC messages "Job start", "Good sheet counter" and "Job end" of the press.
The productivity evaluation offers the following information:
1.Automatic and precise evaluation of the machine productivity.
2.Detailed analysis of every connected press in a selected period:
•OEE Index
•Speed Index
•Time Index
•P-N diagram (speed related to quantity)
•T-N diagram (production time related to quantity)
•Table view on productivity
3.Comparison of all machines.
4.Identification of special jobs.
5.Productivity development and trend.
You can obtain individual advice from the HEIDELBERG Business Consulting team to analyze the reports and identify opportunities for improvement. In addition to analyzing your own machines, this service also includes performance benchmarking, which allows you to anonymously compare your company's productivity with that of other print shops.
Generating a Report for Machine Productivity
Compared to other Machine Reports, you can select several machines for the Machine Productivity evaluation, e.g. if you wish to compare several machines. For that reason, the dialog for recording the data slightly differs from the other reports.
Proceed as follows to create a Machine Productivity Report:
1.Go to "Analyze Point > Machines".

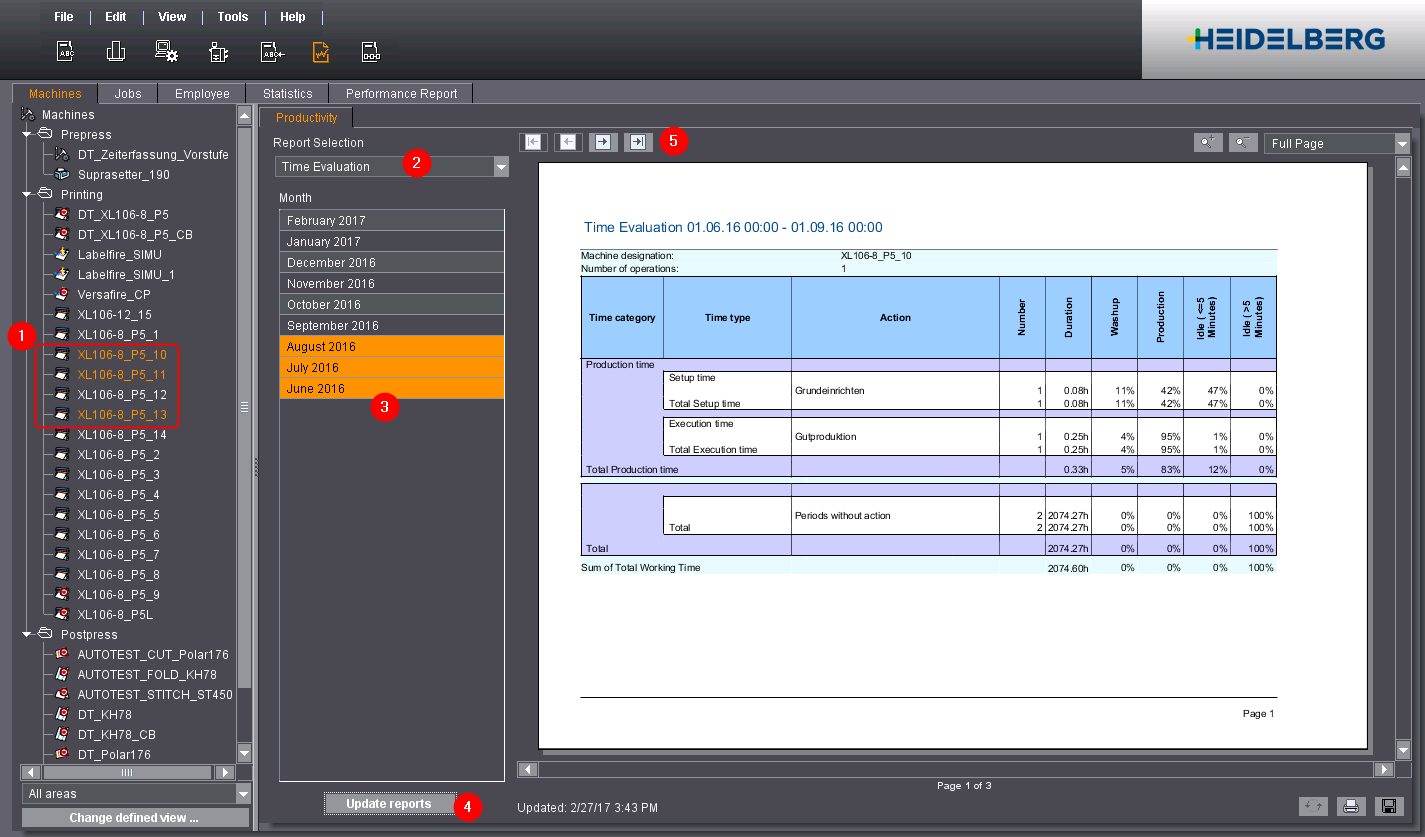
2.In the tree view to the left, select the machine for which you would like to generate a report (1).
To select several machines, hold down the Command key and click the relevant machines. The right side will then only display the "Productivity" report.
3.Select the report type to generate from the "Report Selection" list box (2).
4.Select the period of time for which you want to generate the Report (3).
•Only those months for which data is available are displayed, depending on the selected machine(s).
•Evaluations are only displayed if the required data is available for the selected period and for the selected machine. For example: a speed index cannot be calculated for Data Terminal devices without counter box.
•To select several months, hold down the Command key while clicking the first and more months. You may select only contiguous months.
5.Click the "Update reports" button (4).
The report is generated and displayed on the right side.
6.If you selected more than one machine, you can use the arrow keys (5) to go to the next machine. This is only necessary for few machines.
Prerequisite: A configured system printer is required to print reports. See Defining Windows printers on the Prinect server.
Click the "Print" button to print the productivity reports:

Save to a PDF file
Click the "Save" button to save the productivity reports to a single PDF file.

See also Saving the reports in a PDF file.
Privacy Policy | Imprint | Prinect Know How | Prinect Release Notes